Hydraulic profiling (4 charts)
It all started with a question. "Do you suppose we could find recharge sweet spots?"
This is the question life-long farmer Lyle Nissen posed to Mosca-Hooper Conservation District Supervisor Patrick O'Neill one winter's day in 2012 as they were wondering about the future of farming in the San Luis Valley, talking over coffee at Lyle's kitchen table. The question was not plucked out of thin air.
Years before, around 1984 from Lyle's recollection, there had been a stretch of dry years when not much snowmelt water had come from the mountains, driving farmers in the area to rely more on pumping from the alluvial aquifer to meet their crops' irrigation needs than on the present-year's snowpack. Early one afternoon not long into that 1984 farming season, a well at Lyle's home field began to pump air midway through irrigating his field. A bad sign to say the least, meaning the pump in the well was sucking more than the well could deliver for water, taking the rest in as air. The whole field was already planted, actively growing, and thirsty, and the bulk of the growing season was still ahead. As it happened, that same afternoon was the time when the first ditchwater to come that year arrived at Lyle's property from the Rio Grande River. He routed the water to a reservoir at his home field, expecting it to fill overnight and to utilize that water for irrigating come morning.
By morning, the well had stopped pumping air. There were many feet of earth between the bottom of the reservoir and the top of the water table the field's pump was engaging. Moreover, the reservoir was over 800 feet as-the-crow-flies from the reservoir. But somehow it seemed the two waters found quick connection as the reservoir filled from the ditch. This was unexpected, and so Lyle began to wonder--are there spots where, in a year when there's ample ditchwater, you could route that water so it could refill the aquifer faster, keeping it less exposed to evaporative losses--are there more recharge sweet spots, and is there a way to find them?
Fortunate winters followed 1984, and much more water made it into the aquifer across the San Luis Valley in 1985 and 1986, replenishing the bulk of what had been taken by recent pumping. But drought wouldn't stay away. In 2002, and again in 2003, almost no water flowed in the ditches of the San Luis Valley. The demand on the aquifer to maintain the crops, livestock, and livelihoods of farmers in the region was extreme during this time, and wells in much of the SLV began to pump air, or to collapse and fail entirely. The water stored in the aquifer systems came to then-historic low levels. The Legislature of the State of Colorado took action, passing first-of-its-kind legislation requiring that the San Luis Valley, part of the Upper Rio Grande River watershed, would manage it aquifer systems sustainably. From 2002 through the present, the region has endured many years of drought, and a few years of abundant precipitation, and has undertaken efforts to actively put snowmelt water into the aquifer, and to reduce the amount of pumping at the same time. But these efforts have yielded only modest returns towards that sustainability mandate.
As it turned out, that question about finding recharge sweetspots would stay with Patrick O'Neill for several years, wondering on it as the San Luis Valley began to come to terms with the necessity of returning more water to its now overdrafted aquifer systems. In 2015 he would meet Kate Zeigler of Zeigler Geologic Consulting, who was actively working with Soil & Water Conservation Districts in northeastern New Mexico to assess aquifer resources and their recharge capacity. Upon relaying Lyle Nissen's original question--"do you suppose we could find recharge sweetspots?"--Kate pondered it for a while, and then said yes, she did think it was possible, using geologic and geophysical methods and techniques to develop such information. And that is were the Targeted Aquifer Recharge Project of the Mosca-Hooper Conservation District began.
This project addresses the dual problems of both conserving the existing groundwater resources and attempting to replenish these resources by using geological mapping and geophysical imaging data sets to identify the most effective locations within the landscape to introduce surface water to recharge aquifer system(s). As of 2012, San Luis Valley water users have been mandated by the State of Colorado to achieve recharge in aquifer systems to the point of reaching State-defined sustainable water levels by the year 2032. To accomplish this task valley-wide, in excess of 600,000 acre-feet of water will need to be recharged into the aquifer systems of the region to meet this requirement during the remaining years of the recovery period. Should recharge not meet the required amount, use of wells for irrigation could be severely restricted by the State.
This project will use a combination of surface geologic mapping and water and petroleum well log data to develop multiple detailed geologic maps and attendant cross-sections, beginning in the area of the Mosca-Hooper Conservation District, which encompasses Alamosa County. Once the maps and cross-sections have been compiled, potential points of recharge will be investigated in greater detail using shallow resistivity imaging techniques.
For background to the aquifer recovery issue, see this article (opens in new tab): Colorado farmers fight to save their water and their community's future (High Country News)
by Kate Zeigler of Zeigler Geologic Consulting
This project is part of an array of ongoing efforts to understand how we can affect our aquifers in the San Luis Valley. The Valley's groundwater resources are broken into two informal groups: the unconfined aquifer and the confined aquifer. Due to concerns over the loss of groundwater resources in the Valley, our communities have been mandated to recover the aquifer system by hundreds of thousands of acre-feet by 2031.
This project is focused on a small area in the unconfined aquifer near the community of Mosca and we are seeking to understand where the landscape and the underlying water table can most efficiently accept water to recharge the aquifer system. It's not as easy as just dumping water in ponds and ditches and hoping it moves downwards! Some places take water more easily than others and this project seeks to figure out where those "sweet spots" are.
The Recharge Optimization Project uses a form of geophysical imaging to “see” under the ground with high resolution. We use electrical resistivity imaging (ERI) along linear arrays to develop a 2-dimensional image of the ground. An ERI array consists of many metal spikes driven into the ground that are all hooked up by cables to a computer “brain.”
While the array is in operation, electricity is sent through the spikes down into the ground. Different earth materials respond to electricity differently: some pass the electricity along as conductors and some resist having electricity pass through. For example, sand has a higher resistivity and clay has a lower resistivity. In addition, water can change a material's resistance, as can the presence of salts. We read these images to see where different layers of sand, gravel and clay are, as well as identify where the water table is.
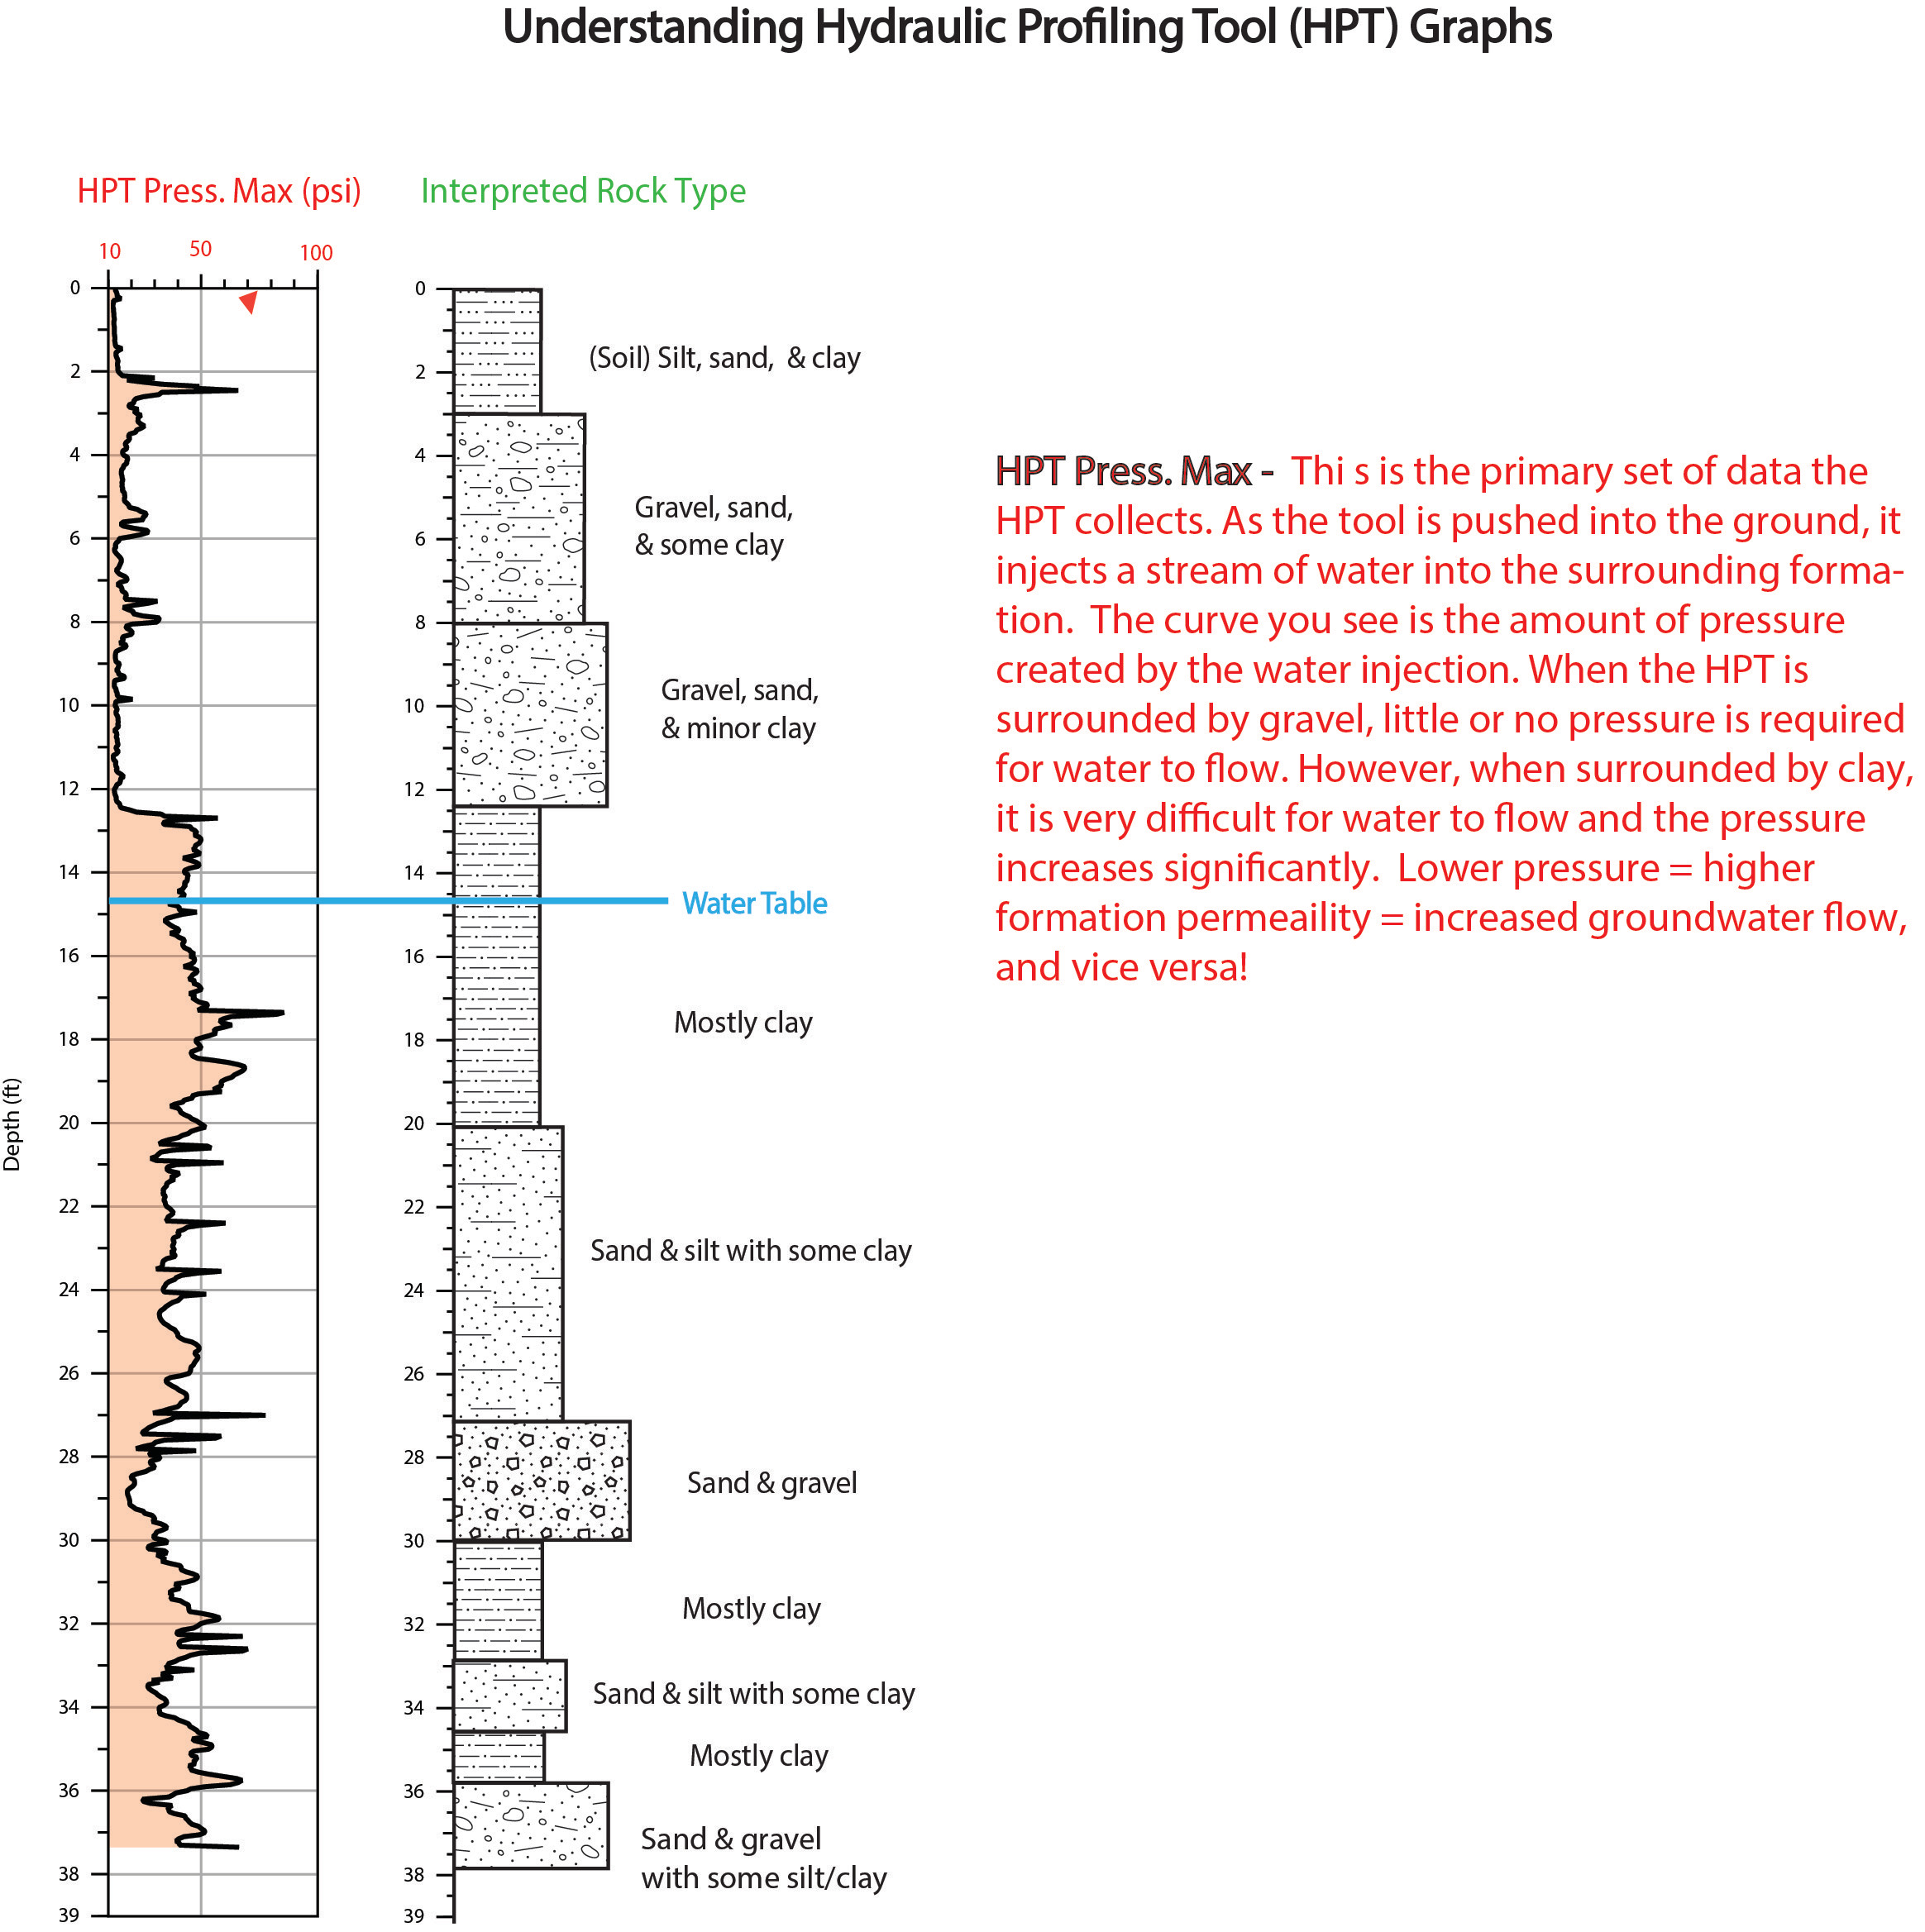
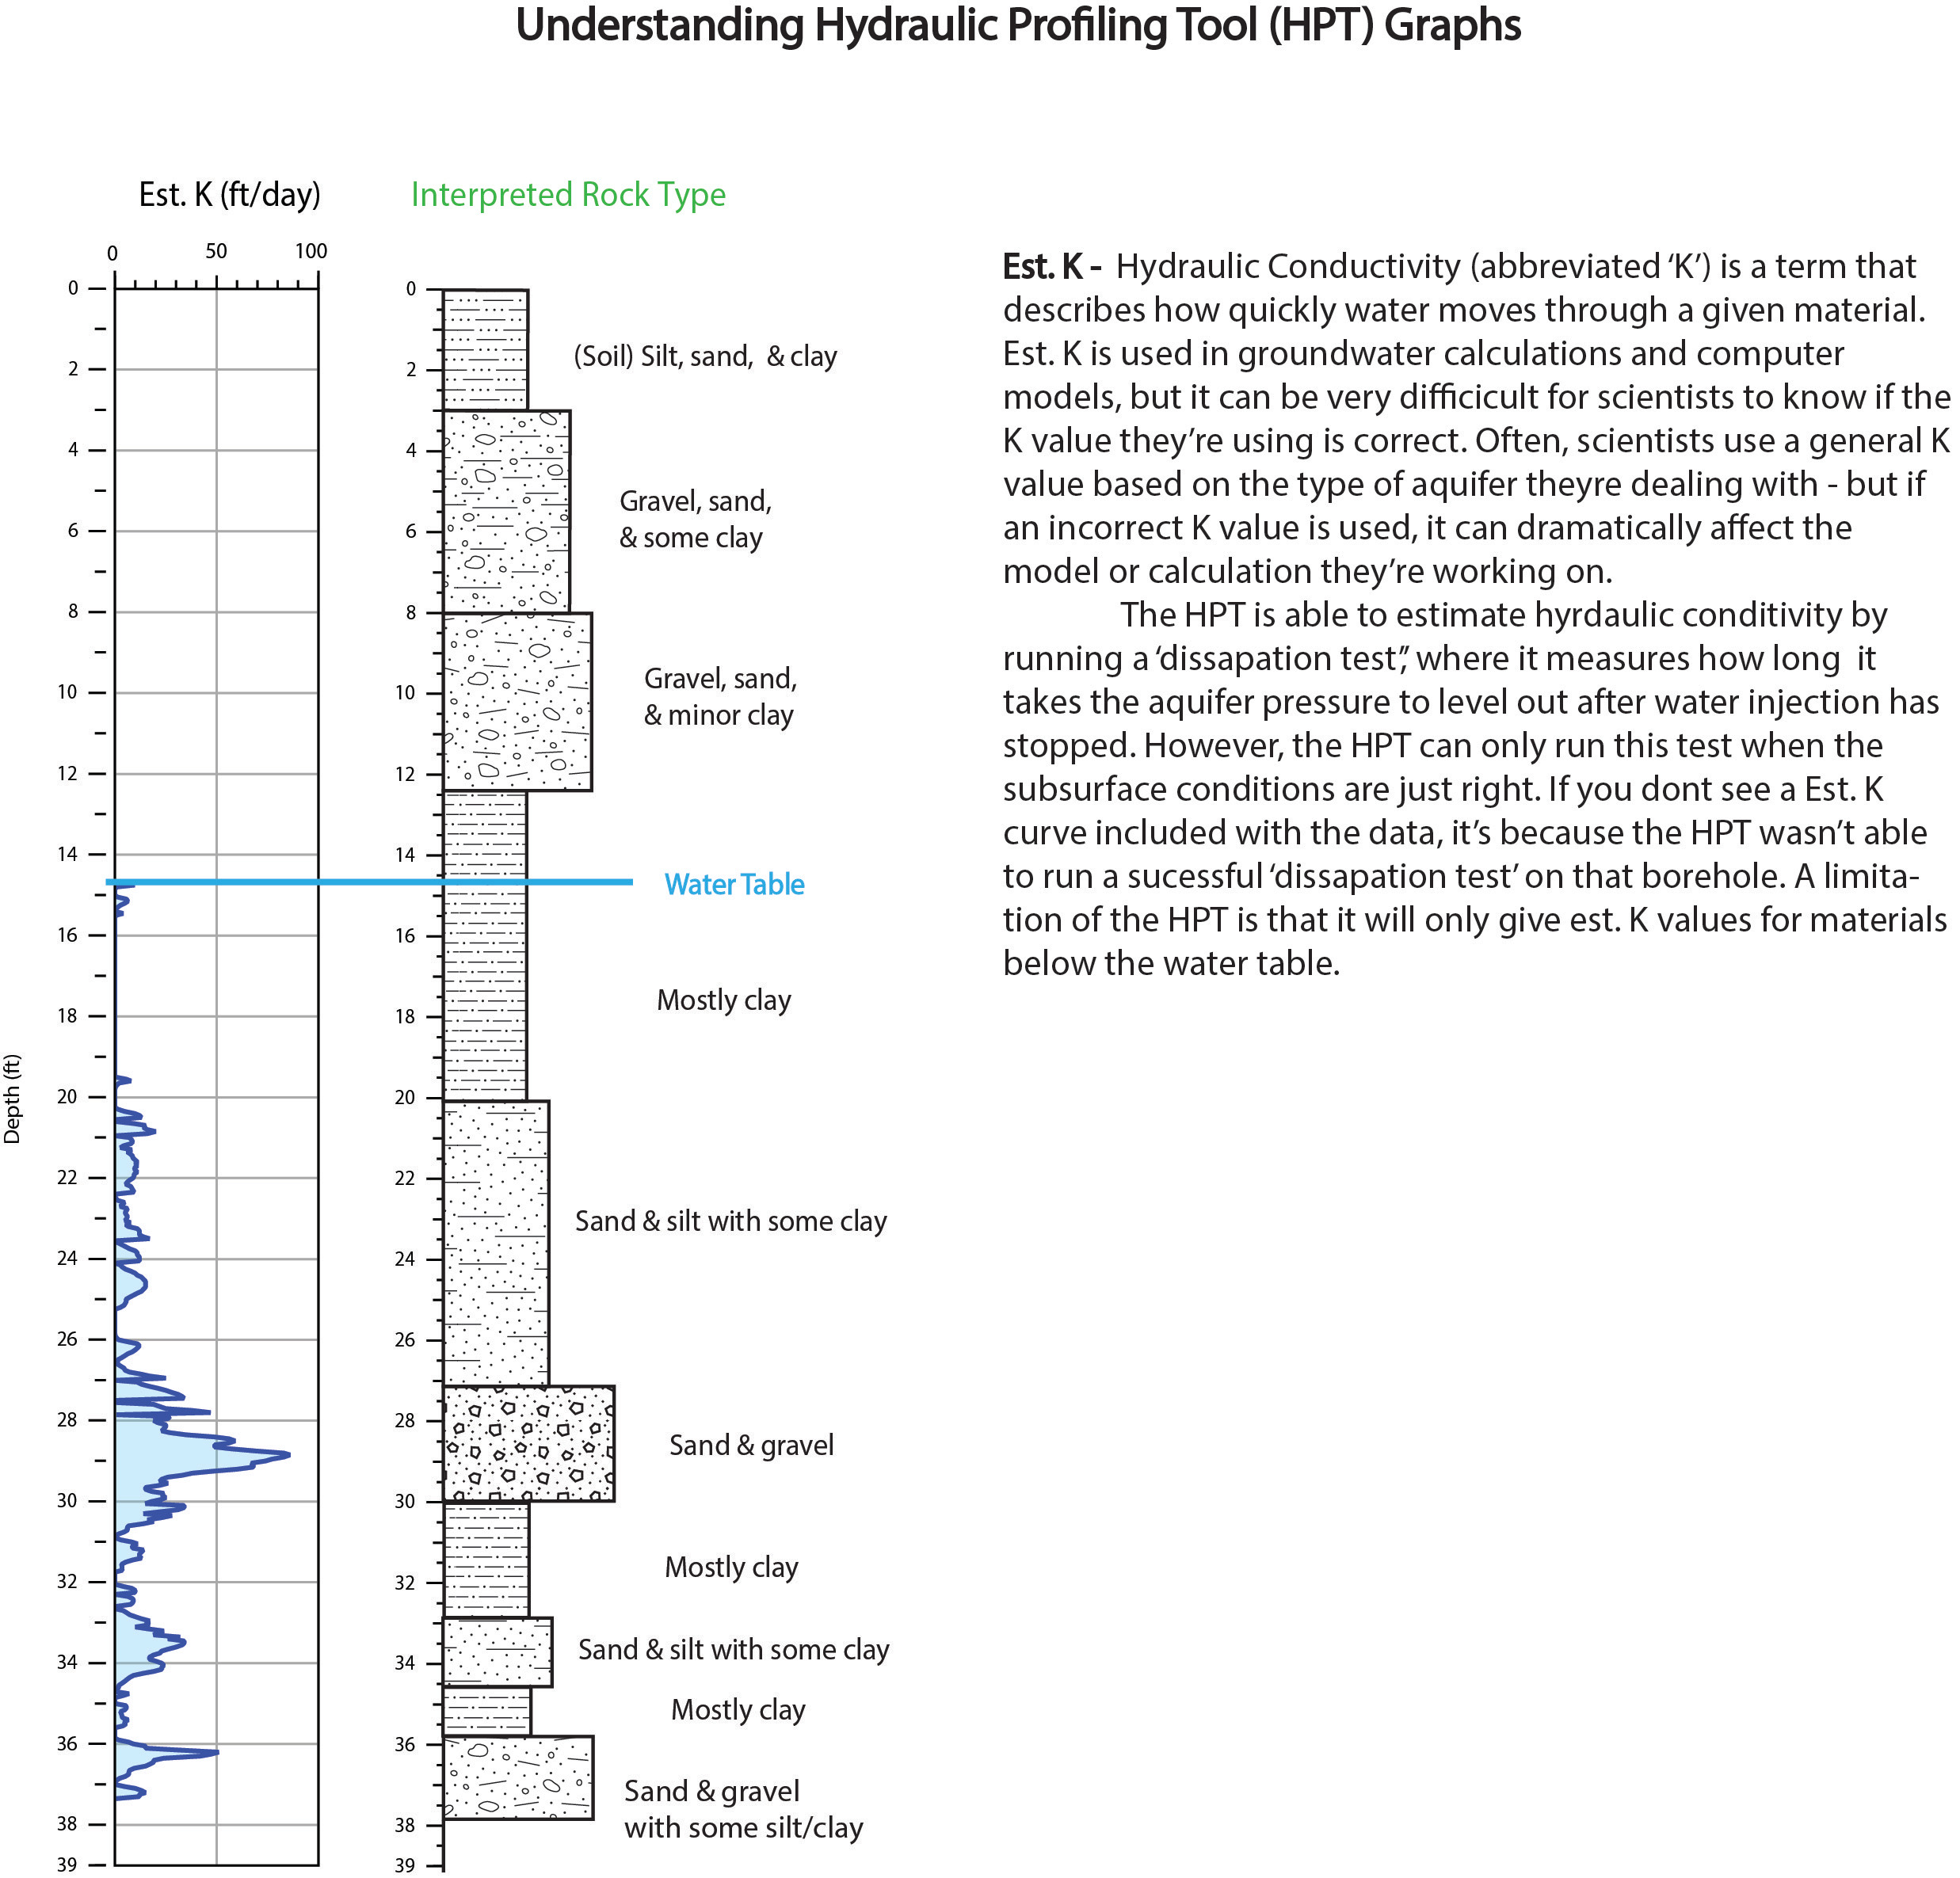
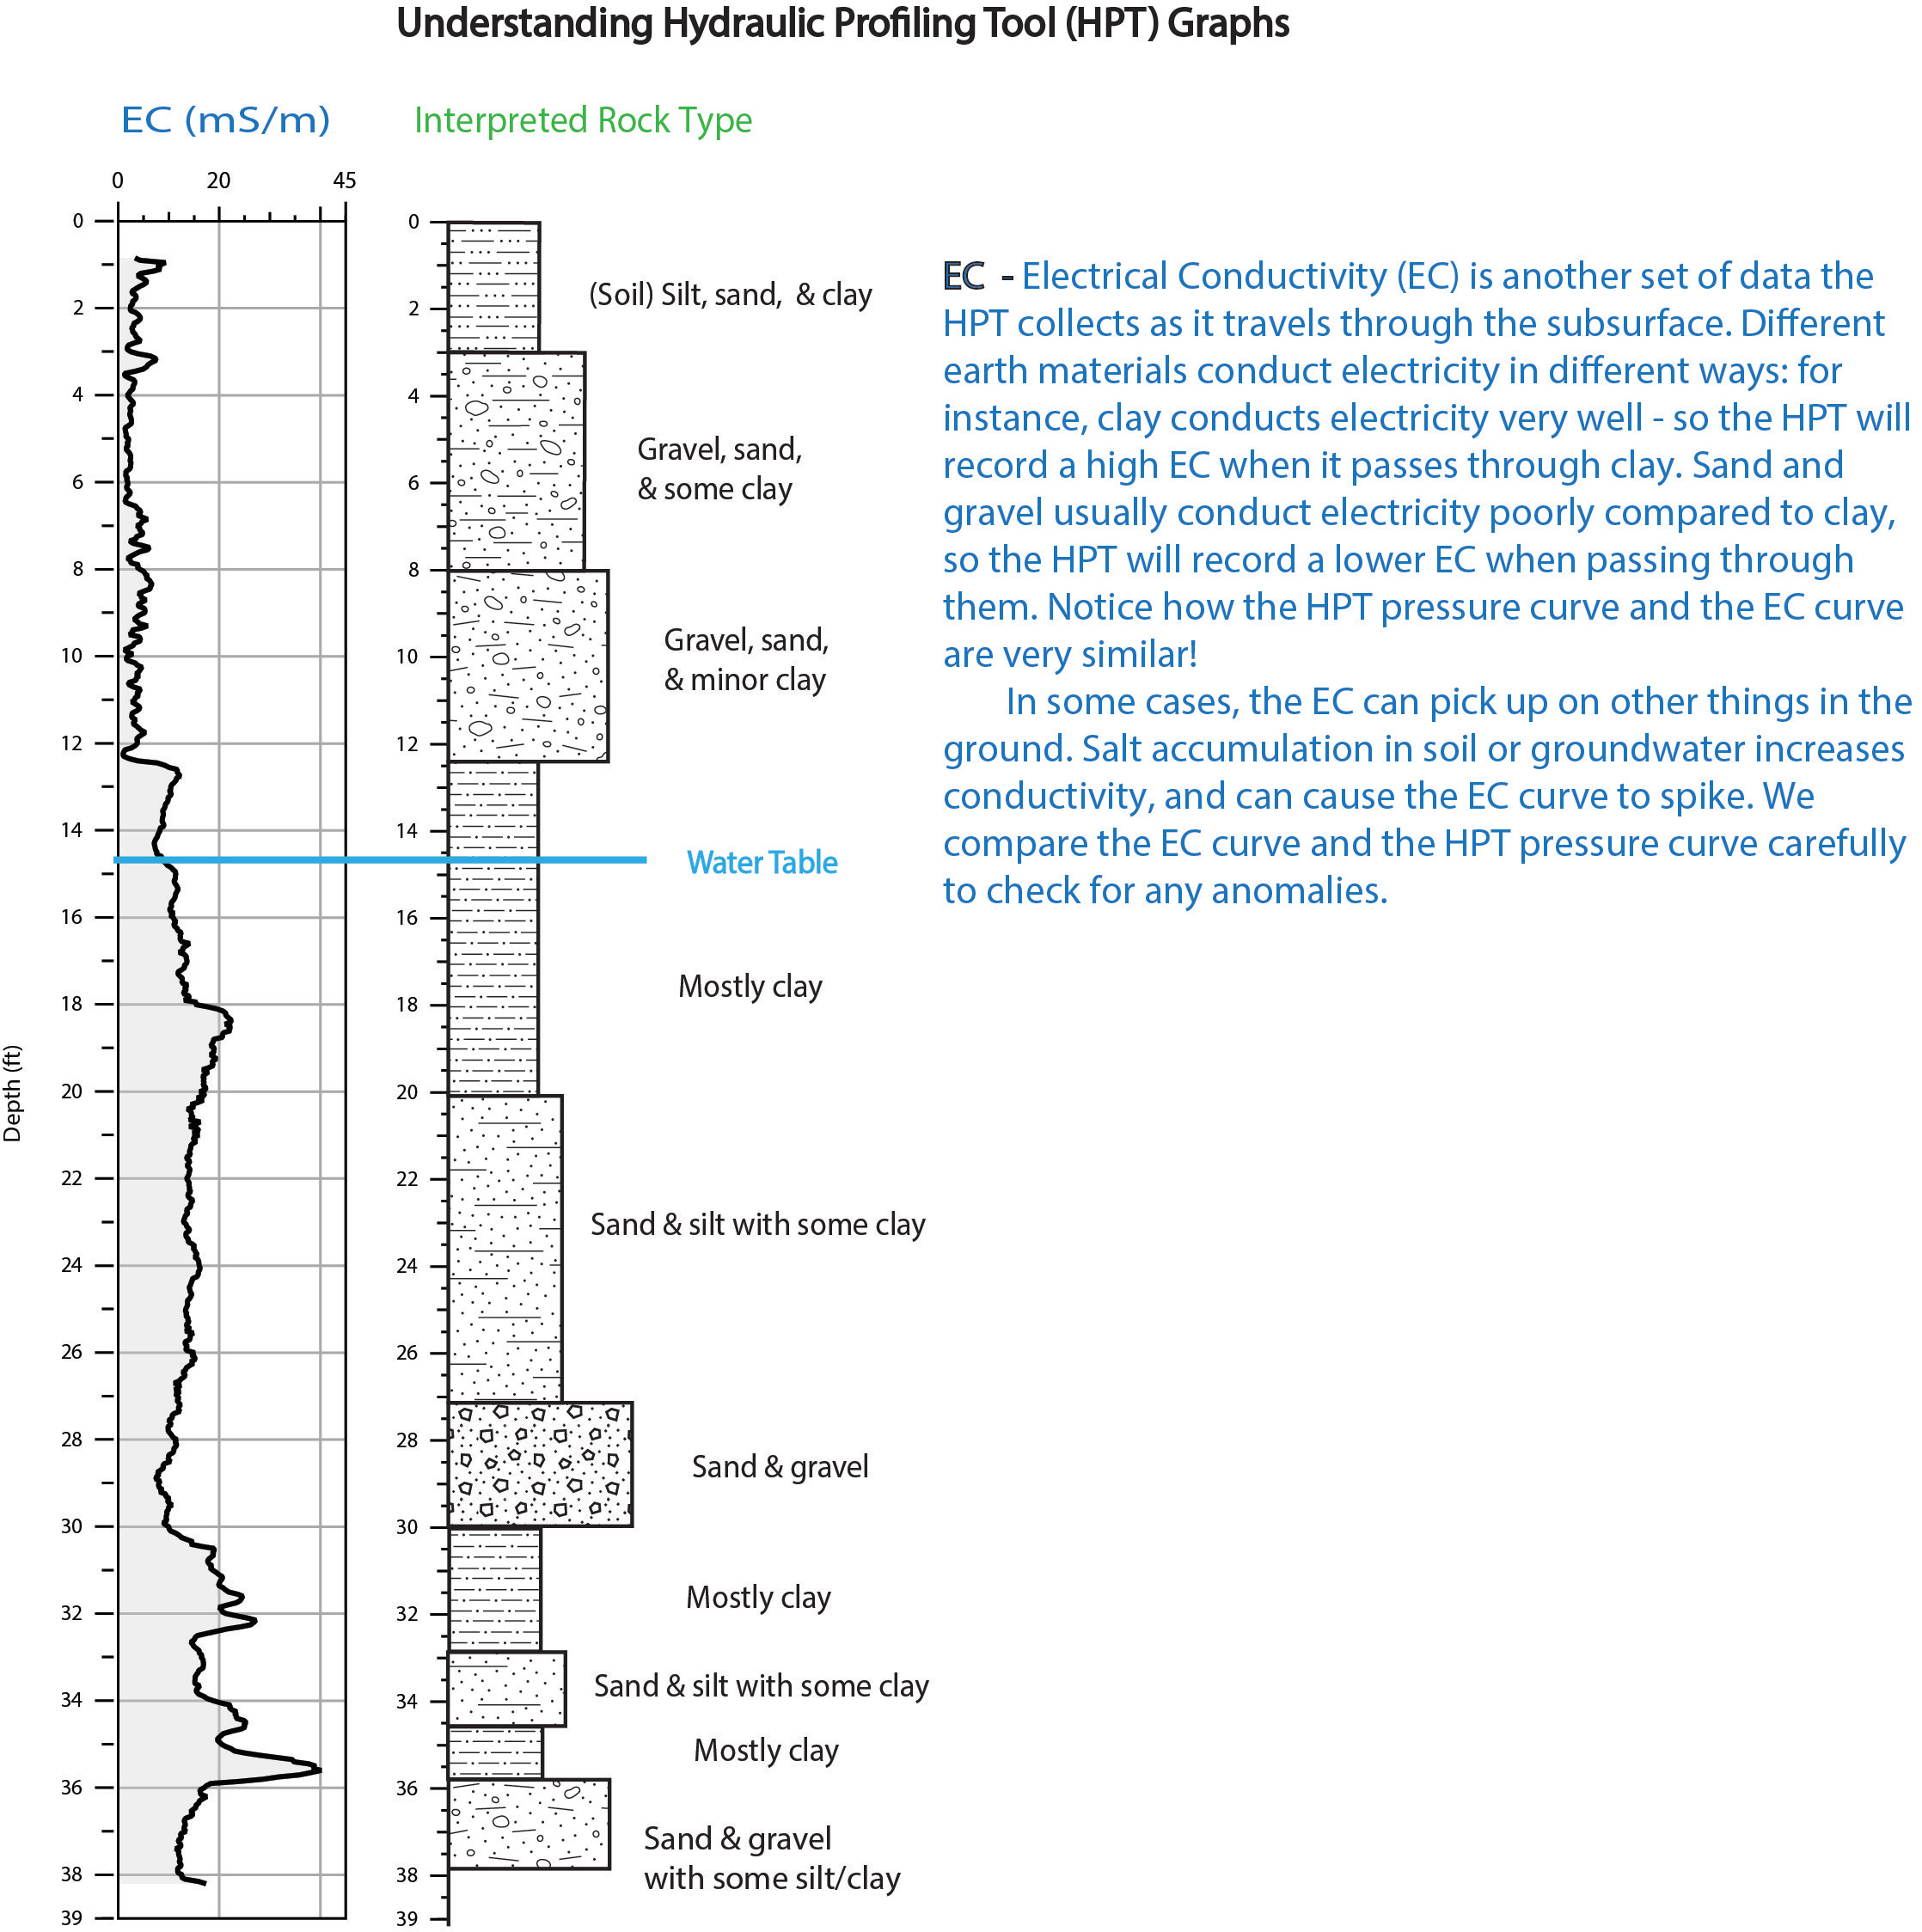
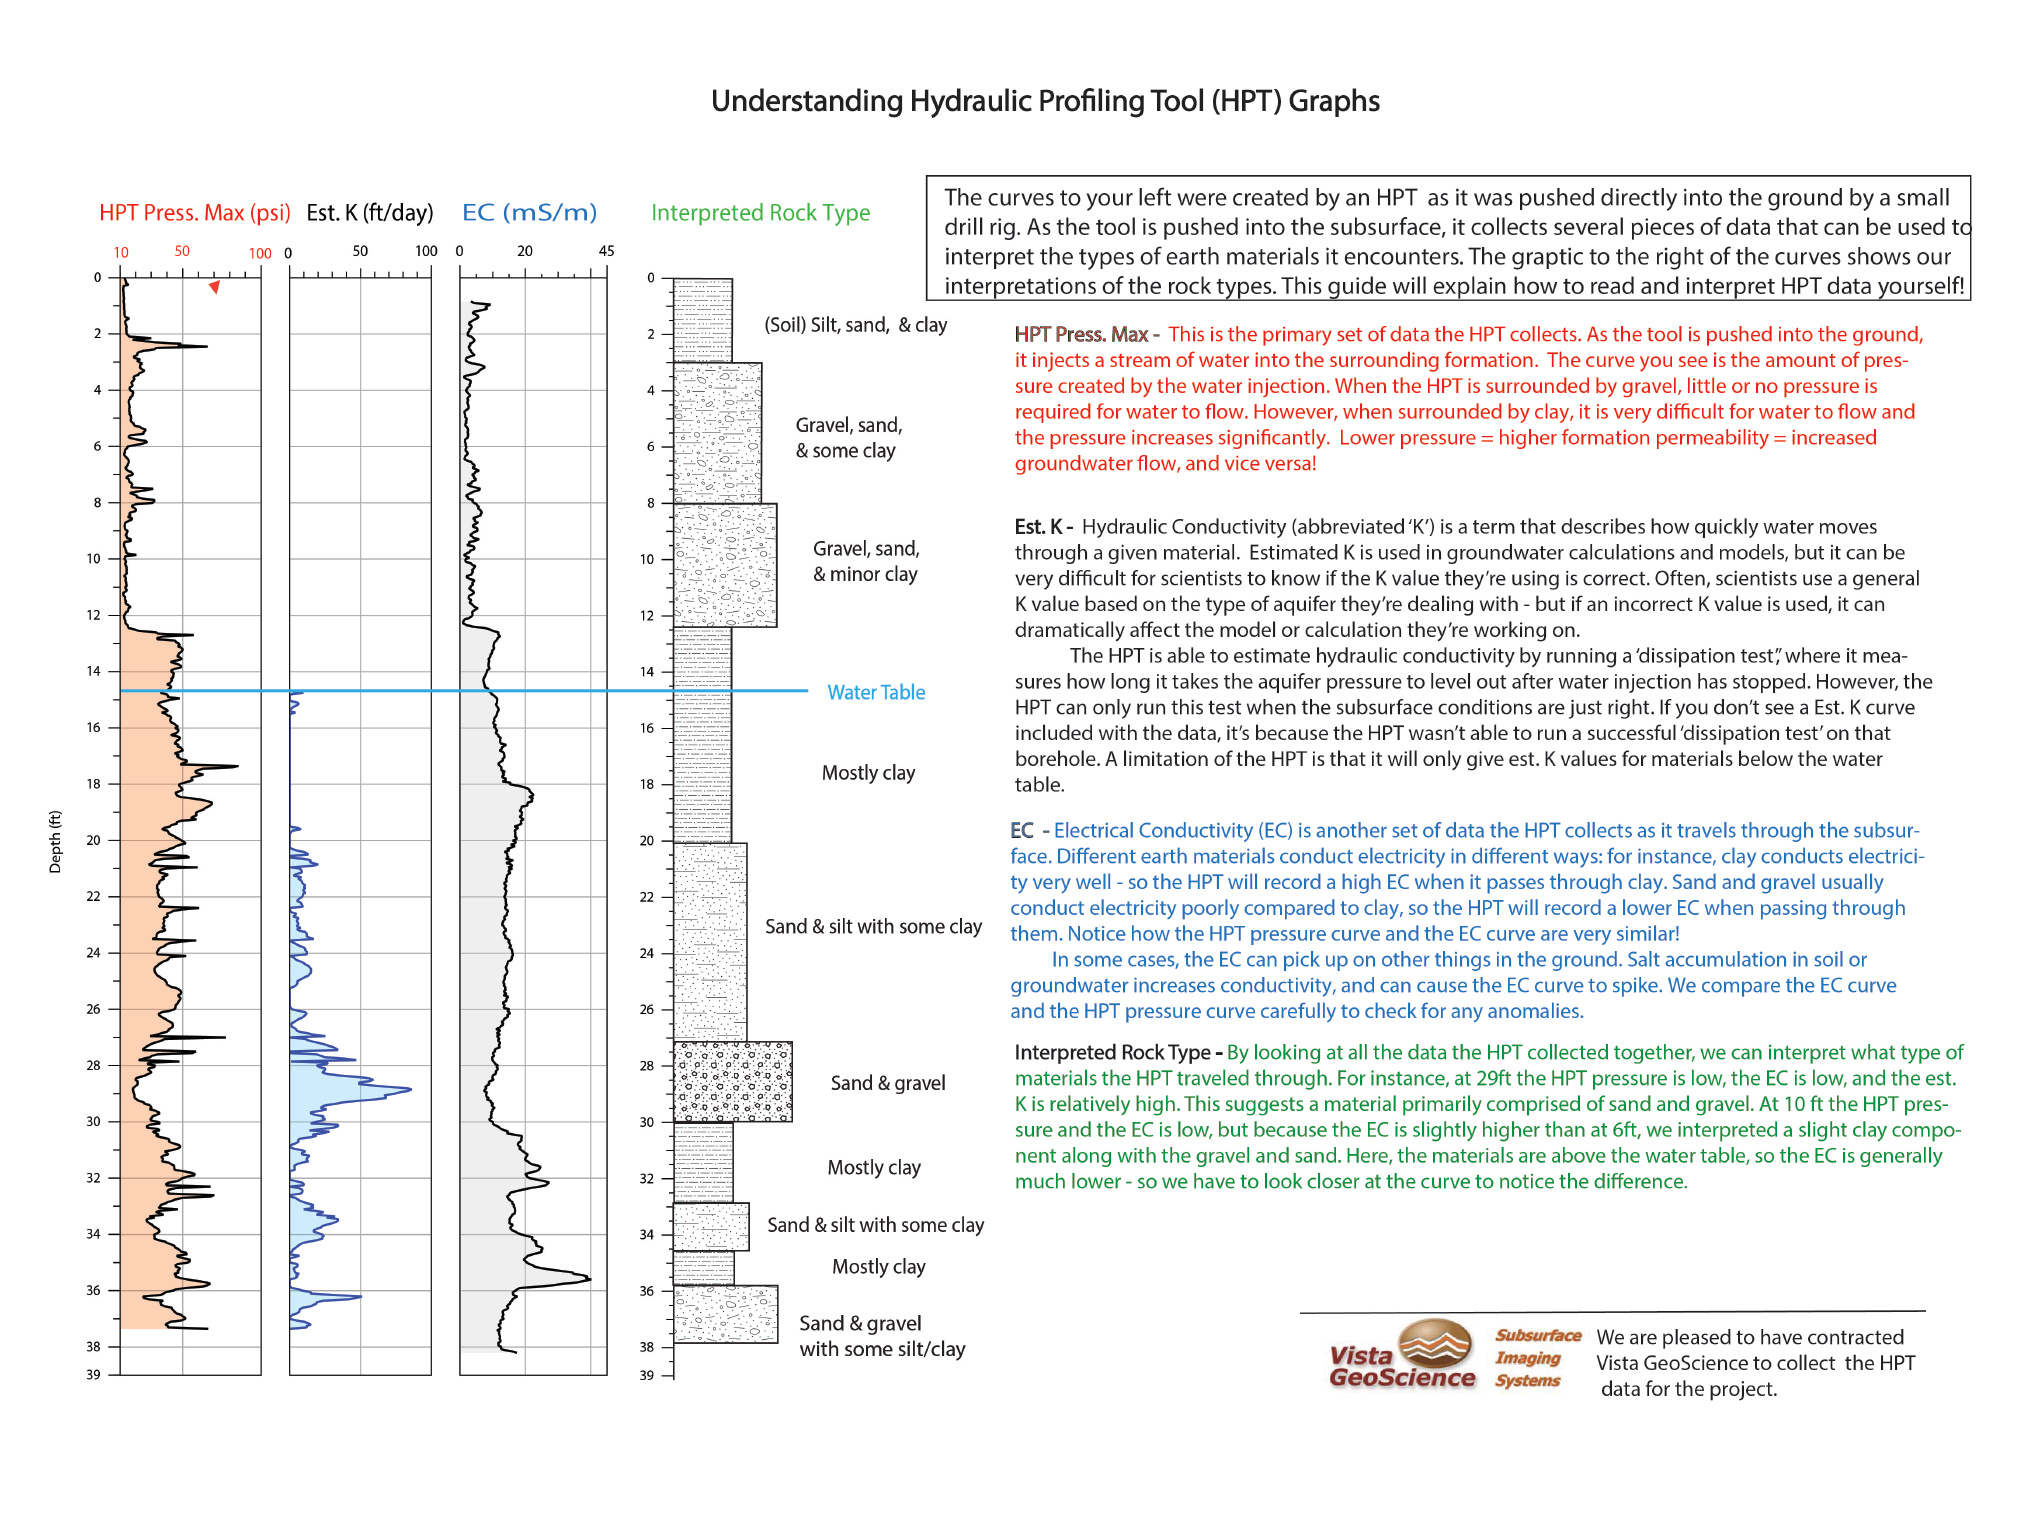
In addition to these ERI arrays, we also drilled five test holes in line with each of the arrays to test what we see in the ERI images. Not only did we collect the sand, gravel and soil that came up out of the holes as they were drilled, but we also used a tool called a hydraulic profiling tool (HPT) to test how easily the layers under the ground can take in water. The data from the HPT is combined with the ERI images to double-check each data set.
We learned several things from the Recharge Optimization Project. The ERI images showed us where old Rio Grande channels are located under the ground, showing us the best places to introduce water in our study area as well as improving our overall understanding of the 3D characteristics of the unconfined aquifer throughout the basin. The HPT data confirmed the ERI images at the specific points the tool was used, providing more data and even better detail than the ERI at those points. These data sets also support the observations of local farmers who described where they got good water when they drilled their wells and how their landscape responds. By employing these techniques and learning in detail how the study area operates, the Recharge Optimization Project has made it possible to make stronger assumptions about how groundwater flows throughout the basin, and how to best approach targeted recharge efforts in the future.
The San Luis Valley is the northern end of the Rio Grande Rift, a moderately wide zone that runs from the Gulf of Mexico up to the Valley. The Rift is exactly what its name implies! It is a zone in Earth's crust where forces are pulling the landscape and underlying rocks apart, creating a valley. A great overview of the geology of the San Luis Valley. See also some videos under the Credits and Links tab.
Rift valleys form when extensional forces tug on the crust, causing the rocks to split apart along normal faults. These faults allow the crust to extend by dropping the rocks on one side of the fault downwards (the valley floor) and lifting up rocks on the other side of the fault (the mountains). As the newly risen mountains begin to erode, these sediments are shed off the mountain fronts as alluvial fans that gradually fill in the newly formed valley. Streams and rivers coming from the mountains also carry eroded material out onto the valley floor.
How does being a rift valley influence the type of aquifer systems we have?
The unconfined aquifer system in the Valley is a product of both the alluvial fans depositing eroded material out onto the valley floor, but also by the migrations of the Rio Grande itself over time. Where the ROP was performed, the sediments that host the groundwater are old channels and floodplain deposits of the Rio Grande as it meandered across the landscape hundreds to thousands of years ago.
Zoom control is at upper left, layer selector (street map or aerial) on upper right.
This map shows the Electrical Resistivity array lines as red lines, well
locations for hydraulic profiling as blue markers
 , and a modeled cross-section as a
green line. Click on lines to see profiles, and on well markers to see
hydraulic profiles. If info window is partly concealed, drag the map.
, and a modeled cross-section as a
green line. Click on lines to see profiles, and on well markers to see
hydraulic profiles. If info window is partly concealed, drag the map.
For background to the aquifer recovery issue, see this article (opens in new tab): Colorado farmers fight to save their water and their community's future (High Country News)
Rio Grande Water Conservation District: Some detailed and up-to-date well information
Mosca-Hooper Conservation District
Continental Rift Volcanism. This video is a good analogue for the rift and adjacent San Juan Volcanic field as one looks south from Salida, Colorado.
Rifting and the Process of Rifting This video provides a detailed description of the entire rifting process. The San Luis Valley is best represented at around 1:10, and is unlikely to enter the later stages of rifting described after that point.
Rift Valleys A very basic short animation explaining rift valley formation. The video does not include volcanism, mountains, or the sediments that would fill the valley.
Rift Valley Formation A basic but thorough explanation of the rifting process suitable for kids. The video does not include volcanism, mountains, or the sediments that would fill the valley, and uses Africa rifting as an example.