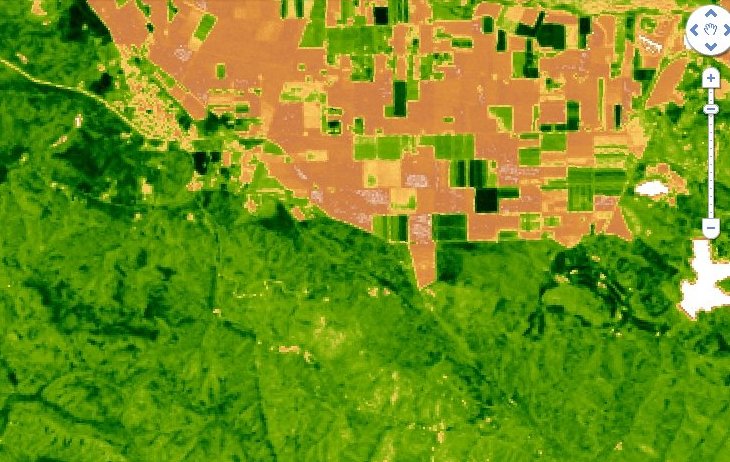
 A 32-day Landsat EVI composite image from Google Earth Engine showing San Juan Bautista, California, from April 7 to May 9, 2010. The town is at upper left. The tan-colored areas, upper center, are farm fields. The darker green areas on the bottom are pasture lands and woodland.
Google Earth Engine is offering 8- and 32-day Landsat Enhanced Vegetation Index and Normalized Difference Vegetation Index (NDVI) composites, plus other satellite data, processed and available in a Google Maps type of interface:
http://earthengine.google.org
[UPDATED Sept 2012 to reflect changes in Earth Engine interface] Click on Data Catalog, choose your data (such as Landsat 7 32-day EVI composite), and then open in workspace. This will open a Google Map window of the earth. Zoom into the area of interest using the + and - bars on navigation tool or your scrollwheel. Click on the layer name in the left window to select a date range. You may need to wait for the imagery to load. Landsat pixels are 30 meters on a side.
To refer back to the underlying terrain map in order to orient yourself, you can toggle the eye icon to the right of the layer name.
This data can already show some striking contrasts in solar energy flow into the biosphere, and will be a powerful tool for showing and monitoring the effects of large-scale policy, such as USDA commodity subsidies or the Conservation Reserve Program, as well as the effects of management decisions at the 40-acre scale.
[UPDATE FEB 2015] see http://www.google.com/earth/outreach/tutorials/eartheng_gettingstarted.html for a good intro to using Earth Engine
Recent Posts
Archive
Categories
- Events (2)
- policy and framing (22)
- ruminations (3)
Tags
- atlas (2)
Authors
- Peter Donovan (135)
- Didi Pershouse (3)