Posted by
Peter Donovan
2 months, 2 weeks ago
in
policy and framing
/
 Share on Twitter
Share on Facebook
Share on Twitter
Share on Facebook
In working on soilhealth.app, I continue to wonder what sort of visualizations of energy flow and change over time might be useful to producers.
Some of the usual concerns of applied soil and range science might be summarized as:
The last few decades have brought an enormous increase in remote sensing: imagery from earth-orbiting satellites, airplanes, and drones, eyes in the sky. Also a quick rise in the availability of all that imagery, and the computational resources to process it into understandable shapes and forms.
There have been many attempts to adapt remote sensing to the traditional tasks of classifying, categorizing, and mapping the parts: the species, categories, substances, and the effects of practices in agriculture and forestry. This is a difficult task and many attempts have been made, with varying success or accuracy.
Gauging changes in solar energy flow is more straightforward. Remote sensing instruments capture electromagnetic radiation that is reflected from sunlight or emitted as infrared. They detect energy and its patterns. They offer a fairly direct view of earth as a recipient and transformer of sunlight energy: surface temperature, evaporation and transpiration, and the ratios of reflection and absorption of different wavelengths indicative of photosynthesis.
- classifications (such as ecological site description, mollisols, alfisols, etc.)
- categories (riparian, footslope)
- species (medusahead, sage grouse, nematode species)
- substances (water, carbon, plant-available nitrogen)
- the effects of practices such as tillage, herbicides, seeding, or grazing regimes.
The last few decades have brought an enormous increase in remote sensing: imagery from earth-orbiting satellites, airplanes, and drones, eyes in the sky. Also a quick rise in the availability of all that imagery, and the computational resources to process it into understandable shapes and forms.
There have been many attempts to adapt remote sensing to the traditional tasks of classifying, categorizing, and mapping the parts: the species, categories, substances, and the effects of practices in agriculture and forestry. This is a difficult task and many attempts have been made, with varying success or accuracy.
Gauging changes in solar energy flow is more straightforward. Remote sensing instruments capture electromagnetic radiation that is reflected from sunlight or emitted as infrared. They detect energy and its patterns. They offer a fairly direct view of earth as a recipient and transformer of sunlight energy: surface temperature, evaporation and transpiration, and the ratios of reflection and absorption of different wavelengths indicative of photosynthesis.
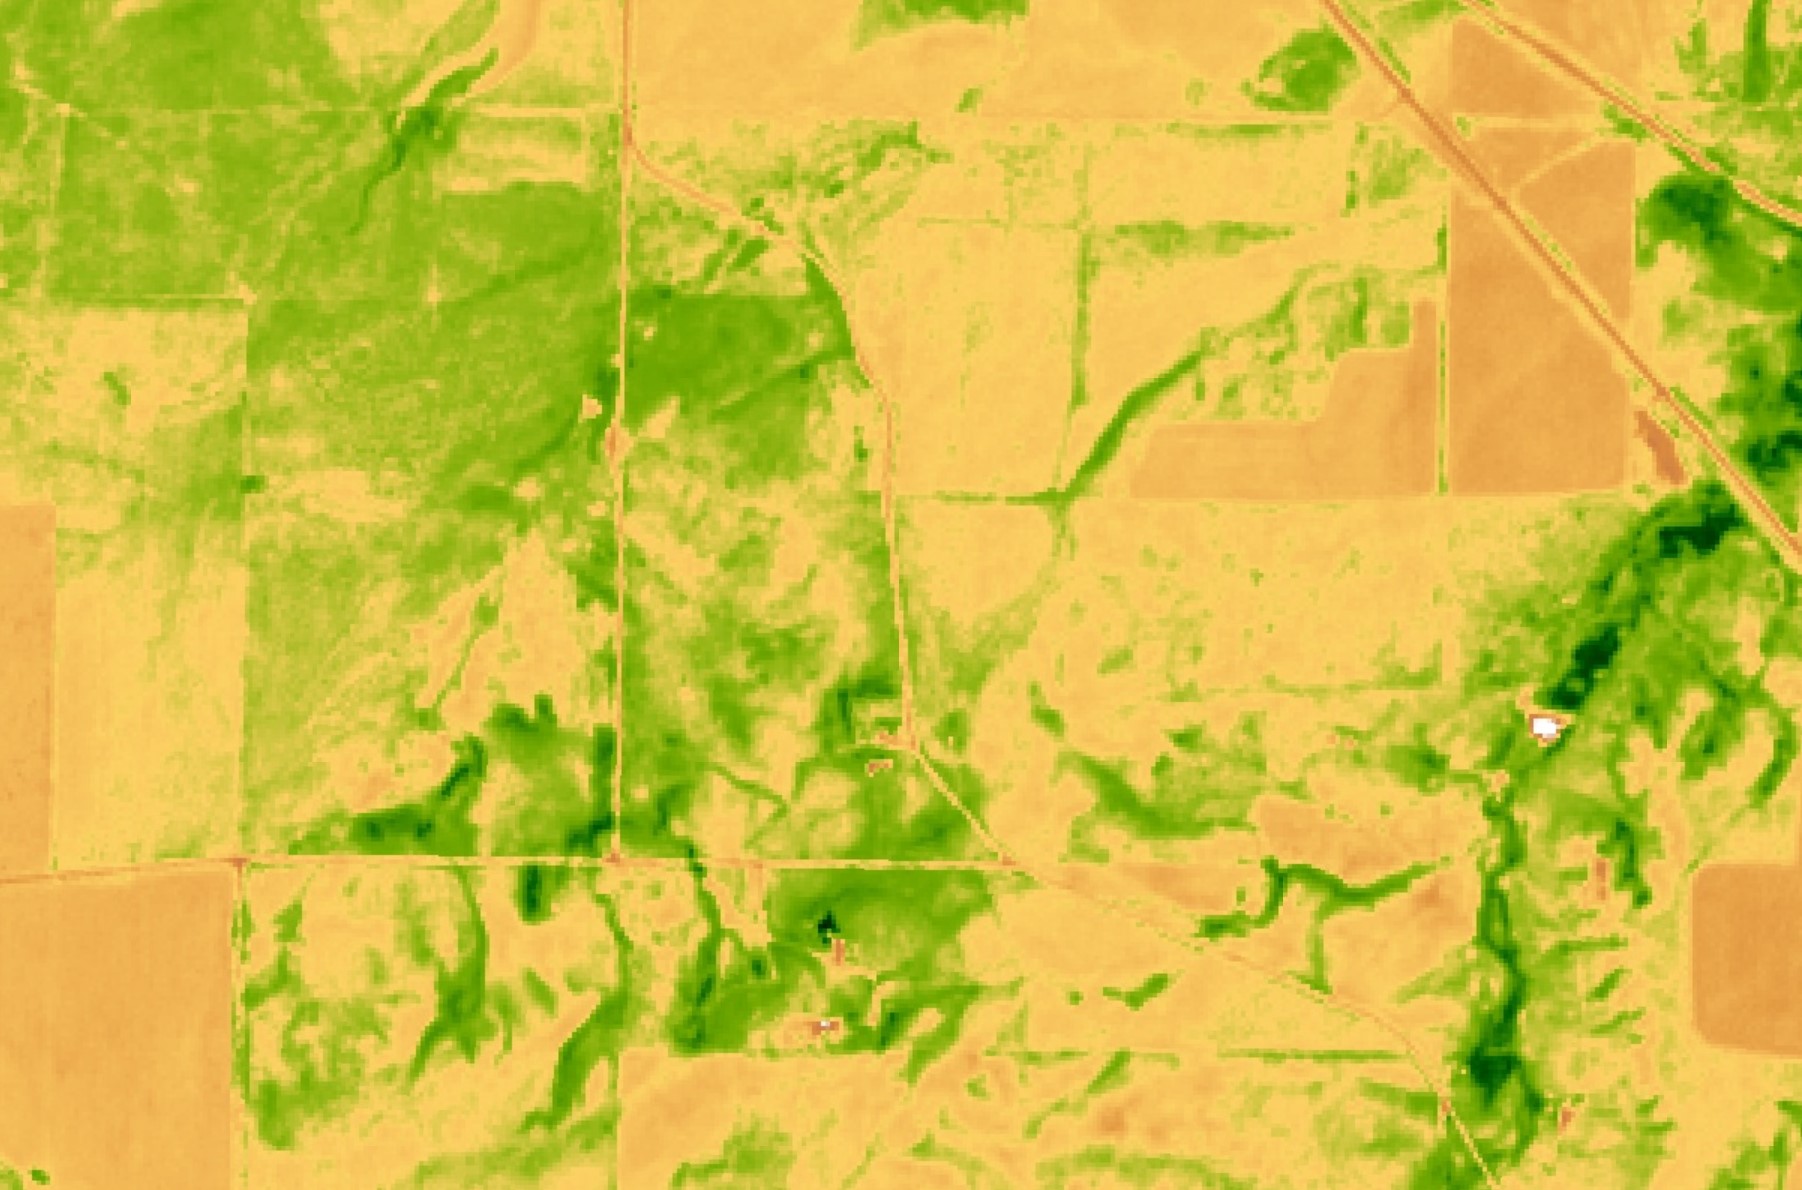
Median normalized difference vegetation index from Sentinel satellite in central Montana for 2022, processed with Google Earth Engine. Greener colors depict the duration and intensity of photosynthesis across the calendar year.
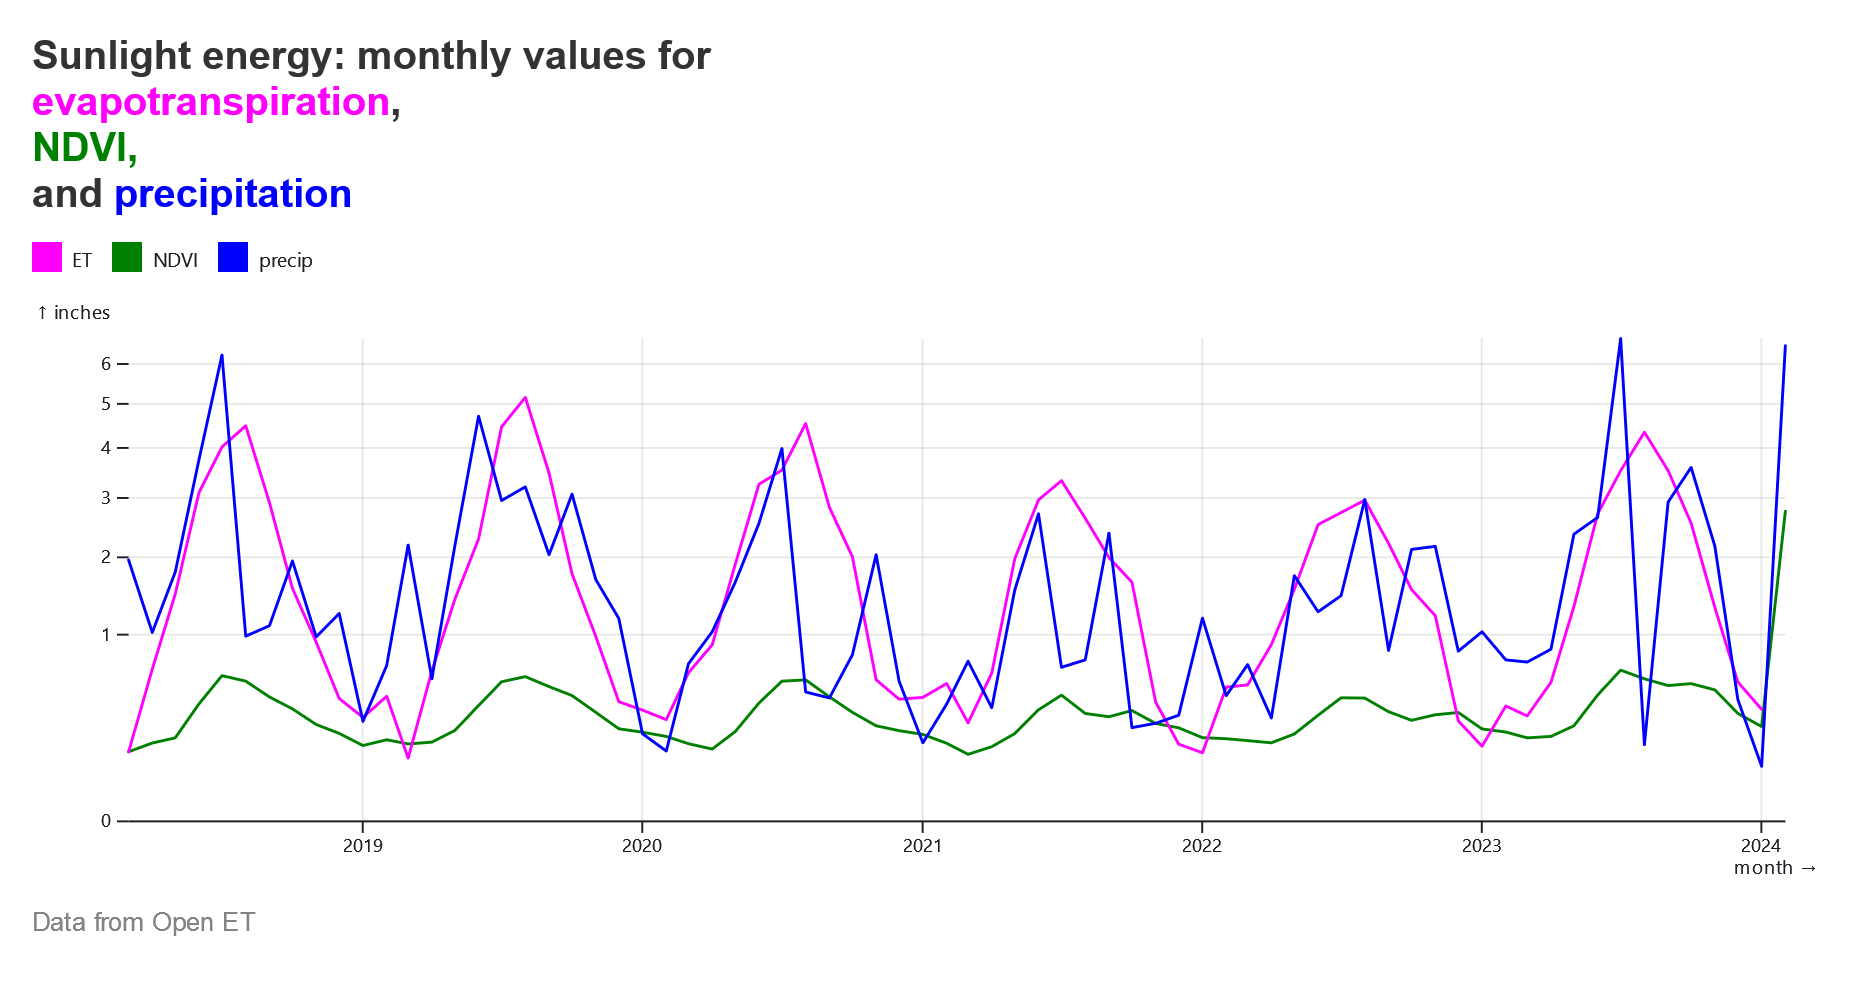
Time-series chart of energy flow on a pasture:
In the case of earth-orbiting satellites, these views are often repeated at intervals of weeks or days, recording changes in these energy patterns over time. This makes satellite remote sensing an ideal means of understanding solar energy flow on multi-acre parcels of earth's surface, particularly in less-cloudy areas: it measures energy more-or-less directly, and patterns can be mapped as well as changes charted over time, such as differences in temperature, evaporation and transpiration, and photosynthesis---all closely related to the near-universal interest among agricultural producers in yields, productive efficiency, life satisfaction, problem detection, and profit, in wholes as well as parts.
Monitoring solar energy flow such as water and photosynthesis helps tell a bigger, richer story, complementing the monitoring of species and categories, perhaps giving a bass line to their melodies. It invites participation, shared learning, producer participation with data on yields, productive efficiency, and water infiltration, and the development of holistic contexts---for some, this is a basic principle of soil health.
Can monitoring and feedback steer management and policy, eventually? Can attention to solar energy flow help create a shared intelligence across society, and perhaps even lessen conflicts over categories, species, substances, or practices? What sorts of visualizations might help, and how can they be shared and interpreted?
Recent Posts
Archive
Categories
- Events (2)
- policy and framing (20)
- ruminations (3)
Tags
- atlas (2)
Authors
- Peter Donovan (133)
- Didi Pershouse (3)