Observations and measurements aren't always "answers." They can be questions too, particularly if they are set up as a time series--a baseline measurement followed by a careful remeasurement at some point in the future. The question might be, how can this land be managed so as to improve or enhance soil health or watershed function?
Observations and measurements on ecosystem function, on carbon and water cycling, are numerous and varied. New ideas, equipment, and techniques are constantly being tried.
We believe in repeatable observations, and there are at least 4 elements to repeatability:
- Accurate location in space and time (because of enormous variability from one place to the next, and from one day or month or year to the next). Consumer-grade GPS (e.g. smartphone) may be enough, but we often use tape, compass, and lines of sight between permanent markers for more accurate location.
- Practical and affordable tools, procedures, and equipment. If an observation takes $50,000 worth of equipment and 4 trained people to operate, it may not be easily or practically repeatable.
- Open data. Lots of data gets put into deep silos, or lost when people retire or move. Storing mapped and raw data in the cloud, with good backups, seems to us the best option.
- People able and willing to make the observations and record them so that they are repeatable (commitment, interest in outcomes).
Download our free guides to some basic observations on soil health and watershed function here, such as: water infiltration, soil cover (including diversity), soil density, soil carbon content or other soil analysis. These observations relate to the basic soil health principles.
A variety of field observations can be entered via our open-source and free web app
Other data
Your county, watershed, or state may have a wealth of data related to ecosystem function, or changes in carbon or water cycling. There is room for a lot of creative and investigative data journalism. USDA, USGS, and EPA have enormous datasets. We expect to be publishing a free guide to common data sources soon.
Some data may indirectly reflect soil health or watershed function, such as the externalized costs. For example, crop insurance indemnities reflect some indirect costs of less than optimal soil health, and many have suggested that crop insurance may subsidize or encourage practices that violate the soil health principles (about 60% of the premiums are subsidized by taxpayers). See our county-level maps of crop insurance indemnities here. We expect to have other county-level data mapped soon (such as FEMA payments for flood and drought). The idea here is NOT to attack these programs directly, but to ask the question: what is the economic opportunity for the nation, for federal and state and local governments, in increasing soil health and enhancing watershed function?
Remote sensing
Satellite or drone-derived imagery can be used to assess photosynthesis, land cover, and many other parameters. It is increasingly available and open source.
We now have first drafts of some length-of-green-season measurements on counties and watersheds in the US over time. Length of green season--the length of the photosynthetic season--relates directly to the soil health principles of living roots, soil cover, diversity, and minimizing tillage.
Here is an example from the Central Valley of California, using the Landsat surface reflectance products from USGS via Google Earth Engine (developer account needed) that shows a substantial lengthening of the NDVI signal (normalized difference vegetation index) once a winter cover crop of mustard was planted in the 2015-16 year and then rolled down prior to planting tomatoes in the residue. This length of green season is the growing period for soil aggregates and the soil foodweb. This cover crop strategy has paid off for the farm, which uses half the N and 2/3 the water as before.
Tomato growth is the "hills" between about day 140 and 270. (And 2018 isn't over as of this writing.) The early and late high NDVI values show the cover crop which was usually planted in November and got off to a good start in 2016.
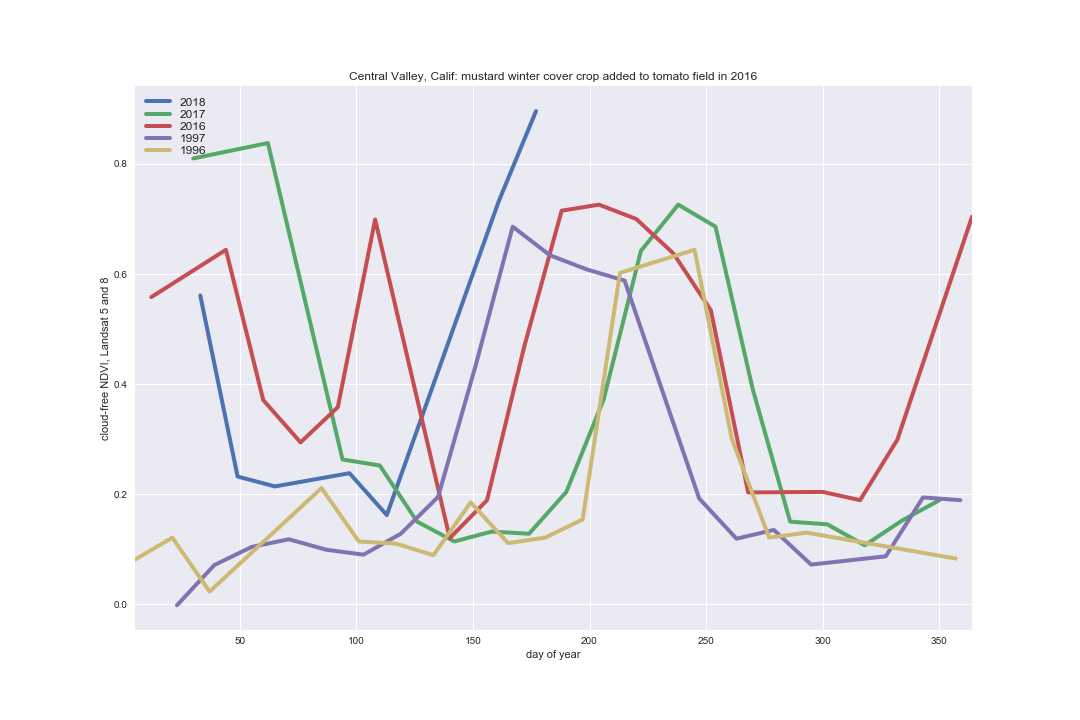
The length of green season calculation is fairly rough because, especially for cloudy areas, the distribution of cloud-free observations over the year can be somewhat sparse.
Tables of numbers aren't very user-friendly for most of us. In order to understand data on water cycling, carbon cycling, soil health, or watershed function, we need to map them. See some length of green maps here. More explanation of tools and technologies.