In the last post on the estimated losses of soil moisture worldwide I promised a more local example of water balances. Here are 1) a pair of charts of precipitation and evapotranspiration in central Montana, and 2) a kitchen-counter water cycle experiment that's easy to do.
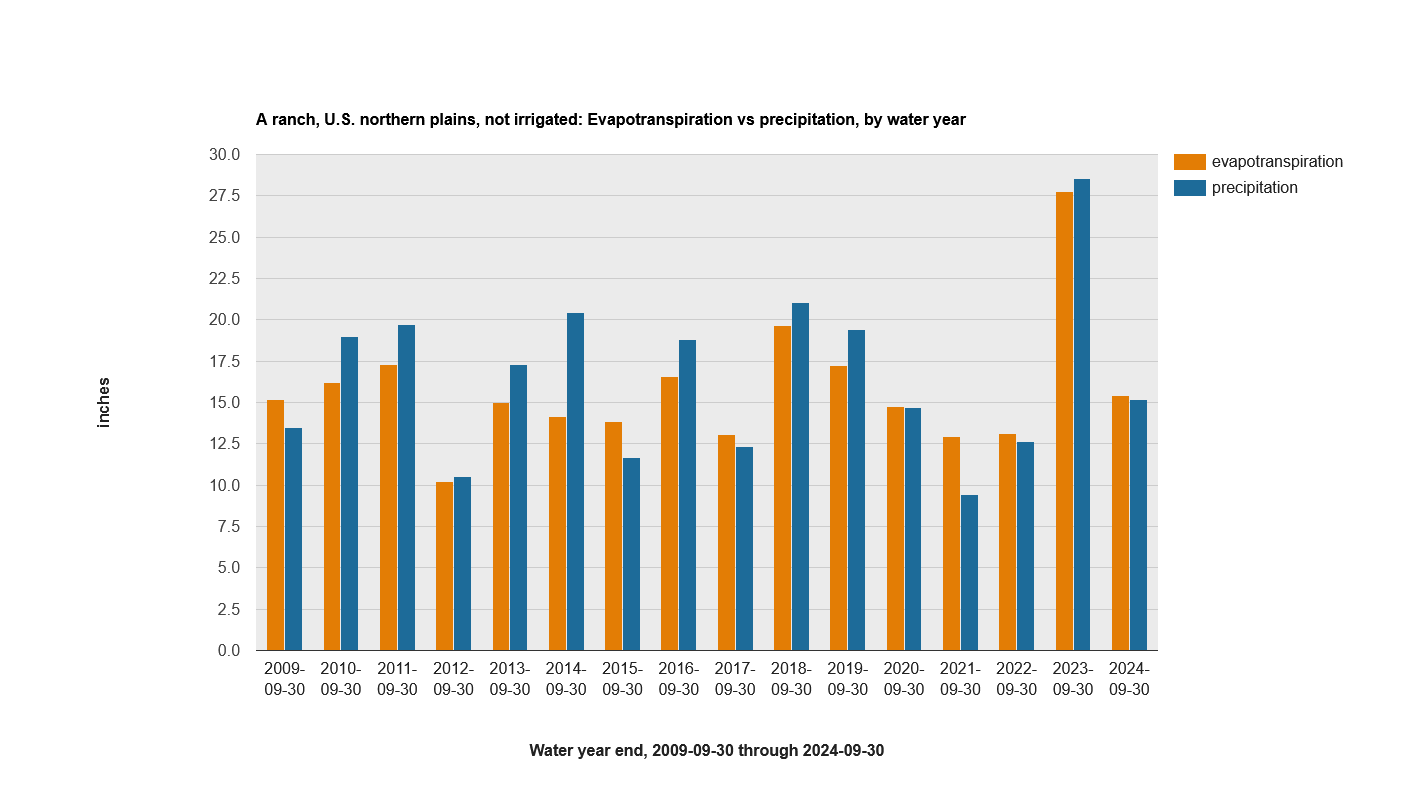
Using evapotranspiration (ET) estimates from OpenET (https://etdata.org/ with their Ensemble model) as well as precipitation estimates from gridMet (https://www.climatologylab.org/gridmet.html), and charted on specific geographies using Google's Earth Engine, this first chart from a ranch, not irrigated, seems to indicate that this relatively level ranch is growing its soil sponge and improving water holding capacity, with evapotranspiration (related to plant growth) catching up to precipitation especially since 2017 or so.
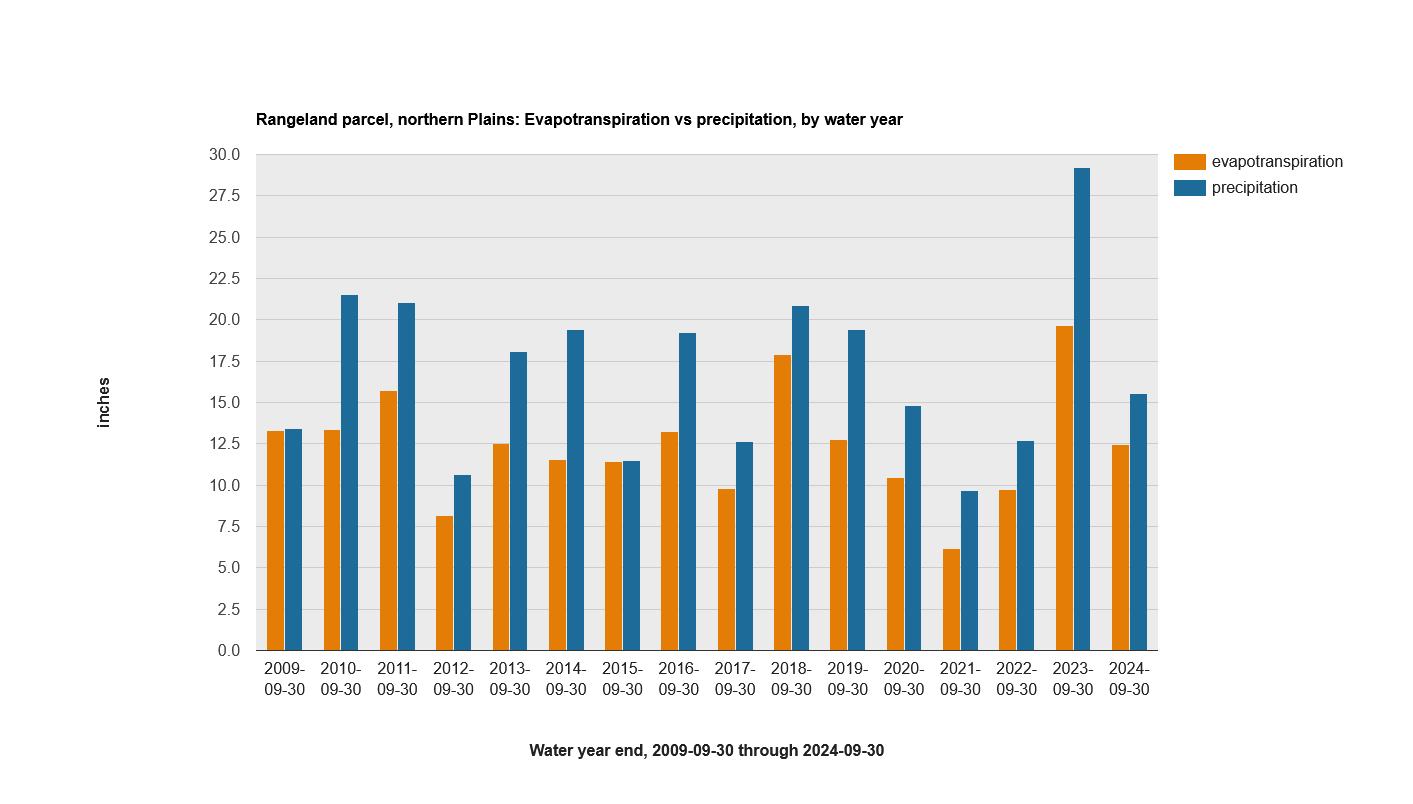
A nearby rangeland parcel shows a different picture in the relation between ET and precipitation. This parcel doesn't do as good a job of holding onto the rain that falls and growing plants with it:
Small differences can accumulate into significant ones, especially with the current trend of droughts and floods increasing (https://www.theguardian.com/world/2025/jun/17/nasa-data-reveals-dramatic-rise-in-intensity-of-weather-events).
Below, an 11-minute video showing the flour vs. bread experiment on my kitchen counter: How you can demonstrate the difference between effective and ineffective water cycling, using readily available equipment and materials, to your friends, neighbors, and policy makers. Thanks to Allan Savory, Didi Pershouse, Walter Jehne, and many others for some of the background. Soil life and the soil health principles enable aggregation, which enables soil to accept and hold rainfall, which enables more consistent soil moisture, the growth of food, fiber, wildlife, biodiversity, and the recharging or maintenance of aquifers.
Recent Posts
Archive
Categories
- Events (2)
- policy and framing (23)
- ruminations (3)
Tags
- atlas (2)
Authors
- Peter Donovan (137)
- Didi Pershouse (3)