NOTE: The Soil Carbon Coalition's updates and posts are now being distributed on Substack.
A recent article — Seo et al., Science 387, 1408–1412 (2025) — uses multiple data sources and models to estimate that the global loss of soil moisture from 1979 to 2016 is responsible for over 10 mm of global sea-level rise — about 3941 gigatons (cubic kilometers) of water. For comparison, the more widely recognized losses of Greenland ice are estimated by the Geological Survey of Denmark and Greenland to amount to 5500 gigatons from 1986 to 2022, contributing almost 16 mm to sea-level rise.
The data sources for Seo et al.’s estimate include gravimetric data from the GRACE missions, polar motion (the variations in the axis of the earth’s spin, which are caused by the redistribution of mass such as water), sea-level rise from satellite altimeters, and modeling using the European Centre for Medium-Range Weather Forecasts soil moisture estimates (ERA5). The paper’s authors point to globally increased air temperatures, increasing vapor pressure deficit, and less well-distributed precipitation as factors that make large-scale recovery of soil moisture unlikely.
The maps in the article estimate losses in many prime agricultural areas:
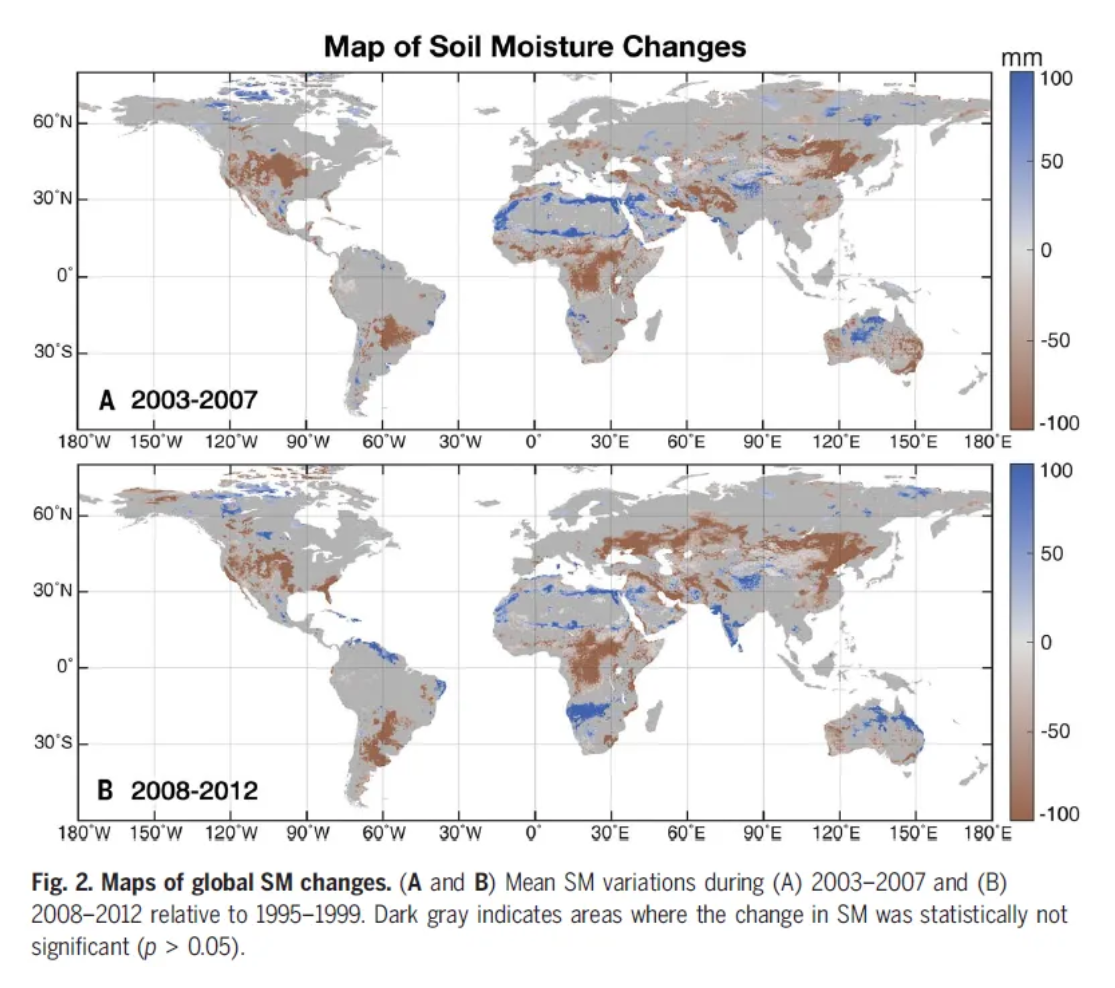
The article makes a brave attempt at a global quantification for the last few decades from a variety of data sources.
As Allan Savory and some others have long noted, the causes or antecedents of this drastic loss of soil moisture have to do with the condition of the soil surface and its ability to accept and retain water. The factors at play here surely include heavy tillage, repeated fires, drainage and destruction of wetlands, fertilizers, deforestation, loss of biodiversity, erosion, unmanaged grazing, and all their combinations. Because soil moisture is embodied solar energy, bare dry and compacted soil represents an enormous sunshine spill, effectively re-routing of hundreds of horsepower per acre of solar power from cycling water to climate warming.
Local water balances
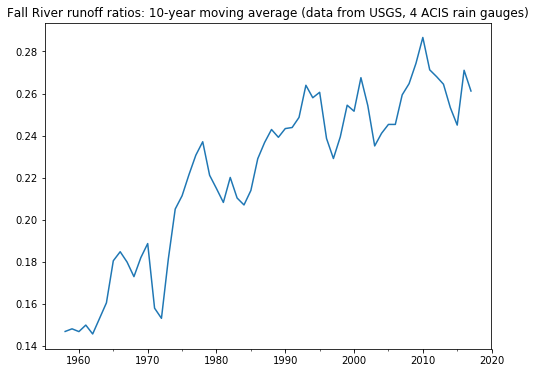
Quite a few local observers have understood that losses of soil moisture have been going on for centuries, that this trend has accelerated in the last century, and that the dehydration of soils can limit replenishment by rainfall, contributing to both drought and flooding. A variety of data sources, including stream gauge and precipitation records, can help quantify or at least point out more local watershed-level trends in soil moisture. Here is an example from Fall River in southeast Kansas, which flows into the Verdigris, the Arkansas, and the Mississippi.
from https://soilcarboncoalition.org/wilson-county-kansas-infiltration-opportunity/
By 1958, the 10-year moving average runoff ratio was about 15%: about 15 percent of what fell as precipitation ended up in the river. By 2018, the 10-year moving average was about 25%: a quarter of what fell as precipitation ran off the land and past the USGS river gauge south of Fredonia.
Over this 60-year period, average annual precipitation has risen, but only by a few percentage points. Runoff ratios increase with increased precipitation, but here we have a large increase in runoff ratios. This difference is about 100,000 acre-feet of water, or about 5 times the current storage capacity of Fall River Lake, that the soils in this watershed are no longer accepting or holding each year.
In 1958, the 10-year rolling mean or moving average of annual flow at the gauge near Fredonia was 256,553 acre-feet. In 2018 it was 359,290 acre-feet. These heavier runoffs move soil. According to Kansas Water Office figures (kwo.ks.gov/reservoirs), Fall River Lake has accumulated sediment equal in volume to the top foot of 17 sections of land since the construction of the dam 70 years ago.
Much of the Fall River watershed is hill pasture, with little bluestem predominating. Pasture burning is common. Bottomlands are typically in corn and soy. Water infiltration can be slooowww.
The OpenET tool which estimates evapotranspiration (plant transpiration plus evaporation from surfaces) in the western US and maps it by year, farm field, and Landsat pixel, is another avenue to explore local trends in soil moisture, and the balance between precipitation and evapotranspiration. I’ll share some examples next time, and you can try it yourself, comparing evapotranspiration and precipitation in the Western U.S. on parcels up to 2500 acres.
Facilitation tips
I see three patterns unfolding, all related to power:
-
the widening circles of (sometimes catastrophic and often complex) social, economic, and ecological change emerging from large changes in water cycling and carbon cycling
-
the widening failures of some institutional solutions for these challenges, with the attendant loss of trust
-
the widening movement in agriculture, natural resource management, and community development toward peer-to-peer, participatory, local learning groups
For those wanting to join movement or pattern #3, shifting from information delivery, pipelines, powerpoints, and program delivery to more of a peer-to-peer approach or community of practice, I’ve put together three somewhat overlapping small booklets to help farmers, ranchers, nonprofit, and agency people who are interested in this shift: $15 postpaid to U.S. addresses. Order at
Recent Posts
Archive
Categories
- Events (2)
- policy and framing (23)
- ruminations (3)
Tags
- atlas (2)
Authors
- Peter Donovan (137)
- Didi Pershouse (3)