Around soil conservation, the questions we ask have been mostly about practices, species, or substances. Practices such as terracing, buffer strips, strip till; species for CRP seeding or edges; and substances such as plant-available nitrogen, phosphorus, or organic matter. Around soil health, we have many new questions (and revitalized older questions), but they also tend to focus on practices, species, or substances.
These questions and concerns are necessary and important, and they help guide practical action. But there is another dimension, less immediately visible. This is the flows and changes of sunlight energy that drive water cycling and carbon cycling, which together make up the most powerful planetary force. Our agriculture and land management have changed and continue to change these flows of sunlight energy in ways we may not intend or be aware of.
Since the 1880s our government has spent hundreds of billions on controlling the rivers in the Mississippi-Missouri system. Since 1931 our nation has spent hundreds of billions on soil conservation. Have we been dealing with a symptom, or a cause?
According to a U.S. Geological Survey report on the water budget of the Mississippi-Missouri basin (https://pubs.usgs.gov/fs/2005/3020/), precipitation increased 2.1 percent per decade from 1949-1997 in the basin, while discharge at the mouth increased 4.5 percent per decade. Estimated total runoff increased 5.5 percent per decade, some of this not making it to the Gulf because it was held behind dams.
You won't read it in the report, but the unavoidable conclusion is that the soils of the central U.S. have become increasingly compacted and less able to accept or store water. Basin-wide, we do a poorer job of capturing rain where it falls, missing our biggest opportunity to capture sunlight energy as water held in covered, porous, well-aggregated soil. What it amounts to is a massive sunshine spill. Some observers in the Gulf of Mexico point to the flooding of 2018-19 as a bigger ecological disaster than the BP oil spill.
If we're going to take responsibility for the capture of sunlight energy, be entrepreneurial about it, it helps to be able to see it, and see it over time. Most of us now realize that covered, porous, and well-aggregated soil depends on green plants, on living roots feeding the soil foodweb, on photosynthesis, on the biological carbon cycle that feeds us all.
Satellite data can be an asset here. Many researchers are sticking to the usual questions, and trying to use satellite data to pick out practices, species, and even soil constituents such as carbon. People use satellite data to look at a vegetative index to show crop stress or predict yields. But we can also ask some different questions about energy flow on our croplands, as with these maps:
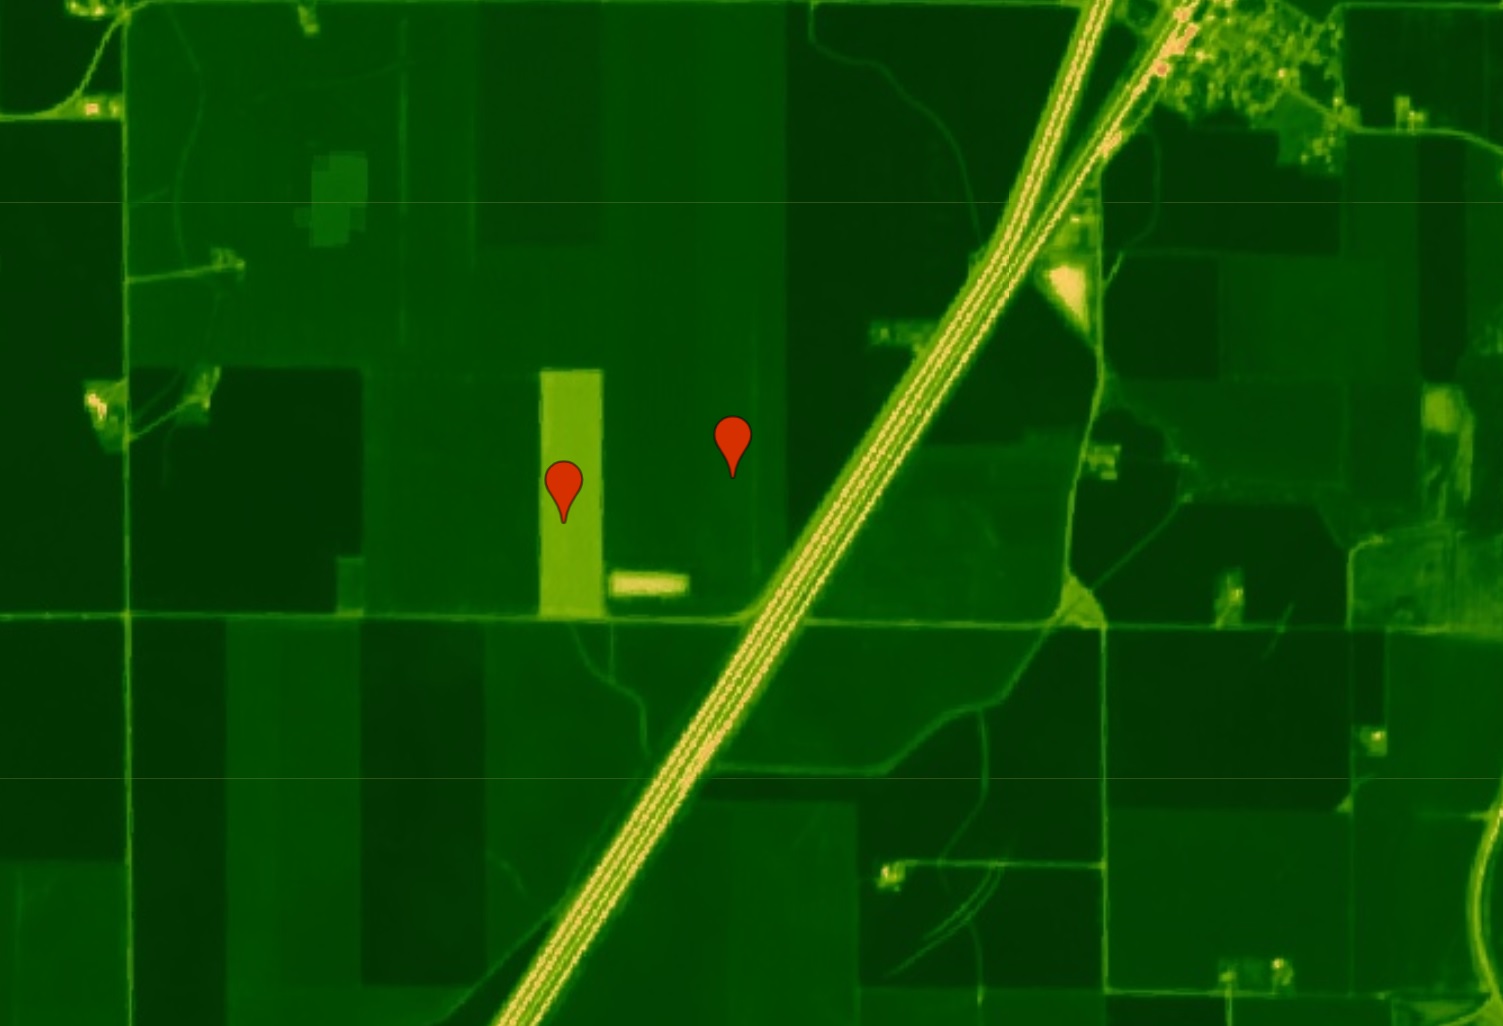
How intense is photosynthesis during the growing season? The map above shows, in darkness of green, the intensity of photosynthesis (Normalized Difference Vegetation Index or NDVI) from July 25 to August 15 in 2018 for an area just north of Elkhart, Illinois. The red marker on the left is in a field where cover-crop experiments are being tried. The marker on the right is business as usual for the corn belt: short-season annual cropping of corn or beans. Data processed from the European Space Agency's Sentinel satellite.
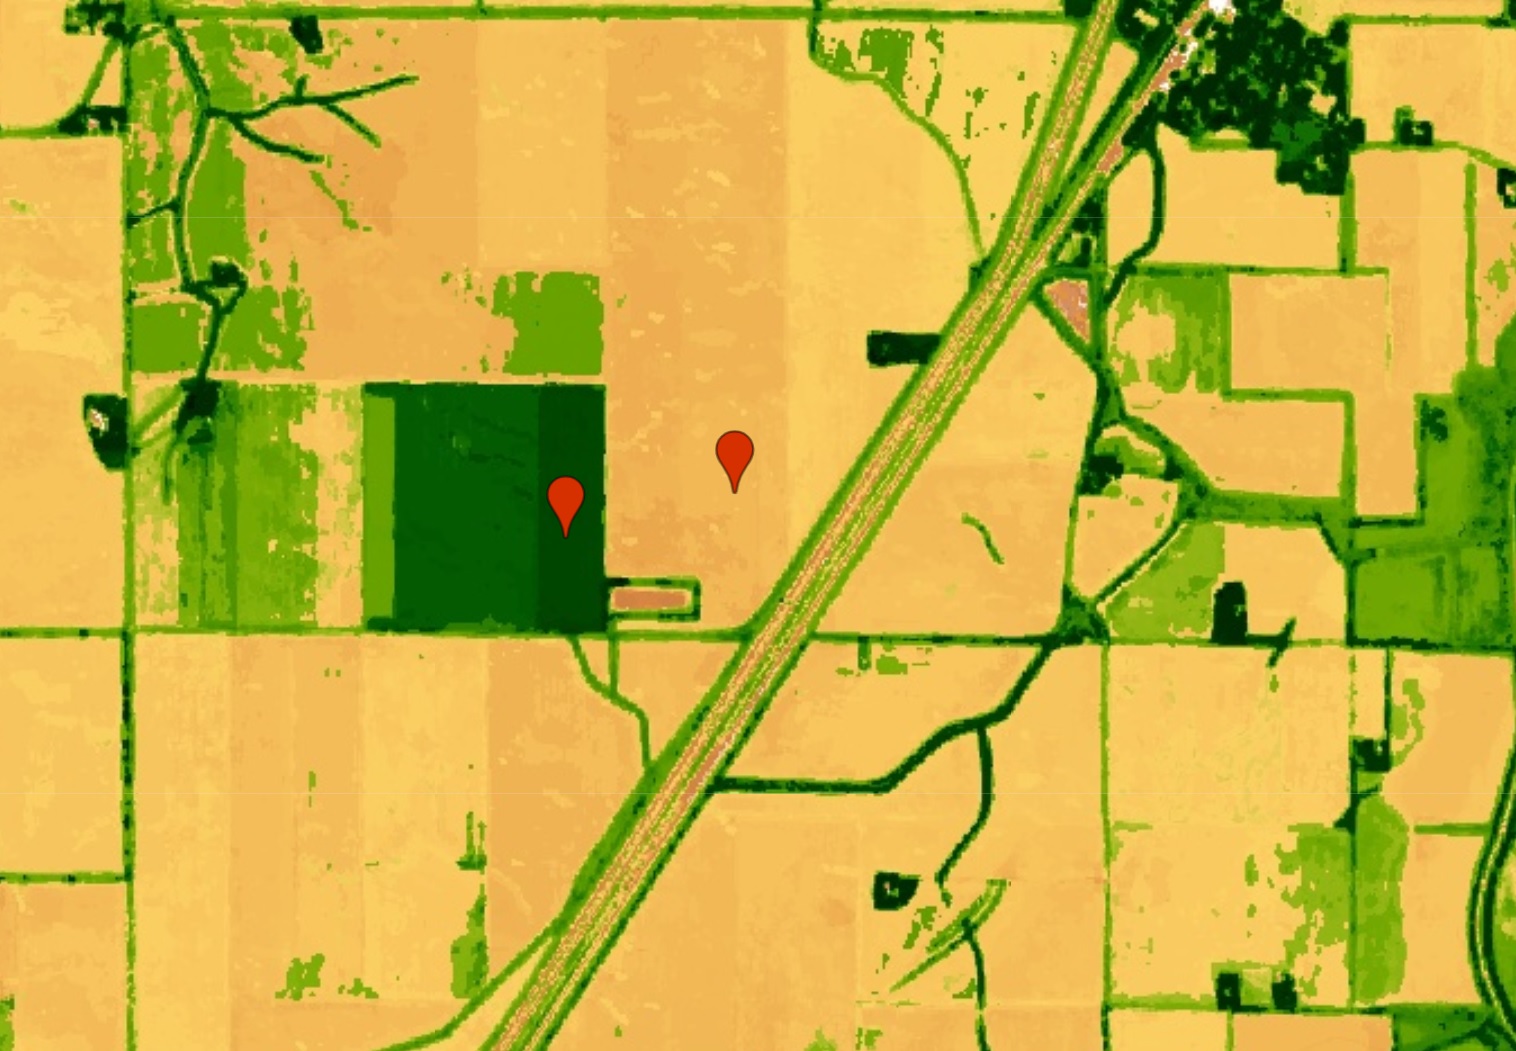
How long are green plants feeding the soil foodweb? Same area, same markers, this map shows number of days of the year in which photosynthesis was over a threshold (in this case, NDVI over .3, averaged over 2017 and 2018). The darker the green, the longer soil life is being fed by plant photosynthesis such as root exudates, and the more chance soil life has to grow and maintain soil structure and aggregation--the soil carbon sponge. The marker on the left shows a more entrepreneurial approach to the capture of sunlight energy, with its much longer season of plant growth. This map shows duration of photosysthesis rather than momentary intensity, and is nearly the reverse of the summer map. Grass waterways, lawns, and roadsides are green 2 or 3 times longer than most of the fields, which are over the threshold of NDVI = .3 only about 90 days. Most of the cropland in this map shows what I have long called a sunshine spill--a waste of available solar energy.
Maps of energy flow can give us additional perspective and help us add principles, such as the soil health principles of soil cover, living roots, diversity, minimize tillage, and integrate livestock, to a focus on practices, species, or substances. For more examples of length of green maps, see here.
Recent Posts
Archive
Categories
- Events (2)
- policy and framing (23)
- ruminations (3)
Tags
- atlas (2)
Authors
- Peter Donovan (137)
- Didi Pershouse (3)