With the arrival of OpenET several years ago, we can now better understand water cycling in the western U.S. over space and time. If we know our territory, we might even detect the footprints of human decisions and agency in the differences and changes that show up.
For a century and more, precipitation data has been collected with rain gauges and snow measuring devices. Now precipitation can also be inferred from satellite observations. Evapotranspiration is the combination of evaporation from surfaces and plant transpiration, which can also be inferred from satellite observations of surface temperature and other variables combining to make an estimate of surface energy balance. Precipitation is water arriving at earth’s surface, evapotranspiration is water leaving as vapor, which is lighter than air and tends to move upward. Water on land also represents sunlight energy: about a third of the sunlight energy reaching the earth’s surface evaporates water.
OpenET provides “scientifically rigorous satellite-based evapotranspiration (ET) data” and is easy to use, giving monthly totals of 6 ET models and precipitation. It includes a Farms tool that can provide detailed reports (including daily estimates) of ET on specific fields or parcels. It runs on Google’s Earth Engine, “a multi-petabyte catalog of satellite imagery and geospatial datasets with planetary-scale analysis capabilities.”
A few months ago, the OpenET consortium extended their estimates of evapotranspiration back to the year 2000, which made possible a viewer/explorer app (also on Earth Engine) for water balance (precipitation minus evapotranspiration) in the western U.S. over a longer time span. (OpenET now provides estimates for the eastern U.S. from January 2020 on its Data Explorer.) This app is now public at
https://managingwholes.users.earthengine.app/view/precipvset
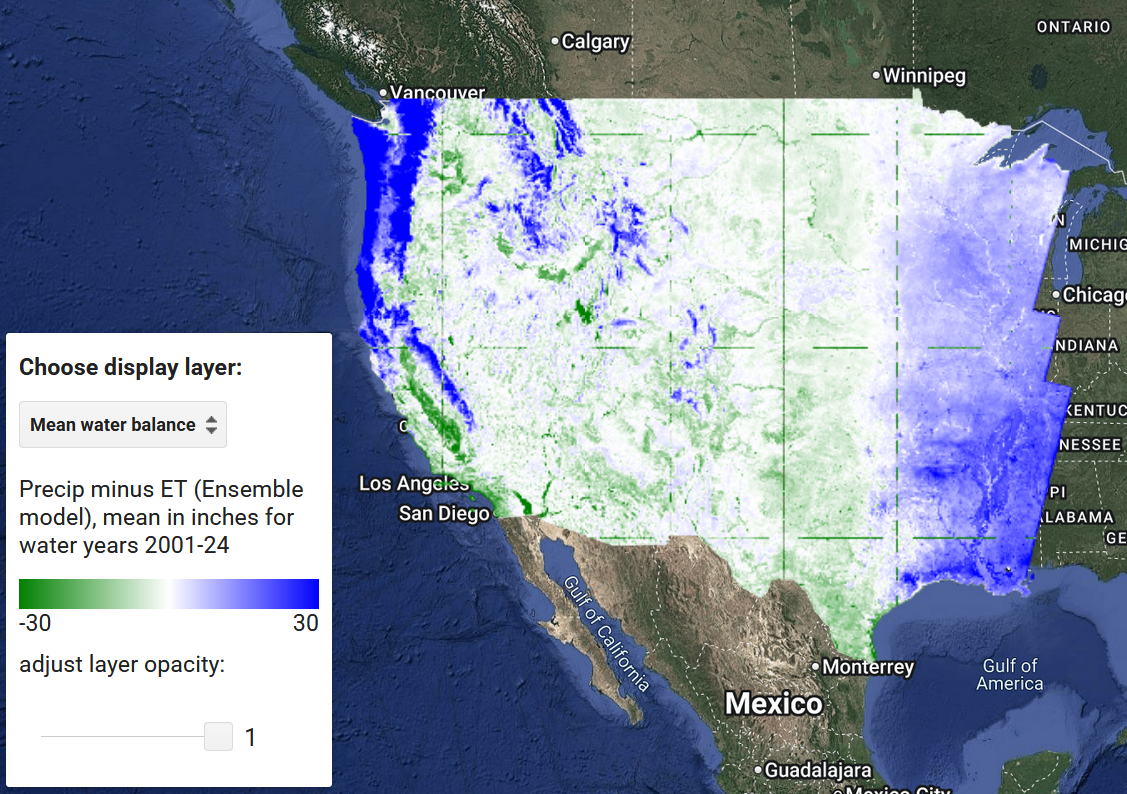
In the screenshot above, blue represents Landsat-sized 30-meter pixels where precipitation exceeds evapotranspiration, green the reverse (often irrigated or sub-irrigated), and white where precipitation and evapotranspiration are approximately in balance, averaged over the 24-year period.
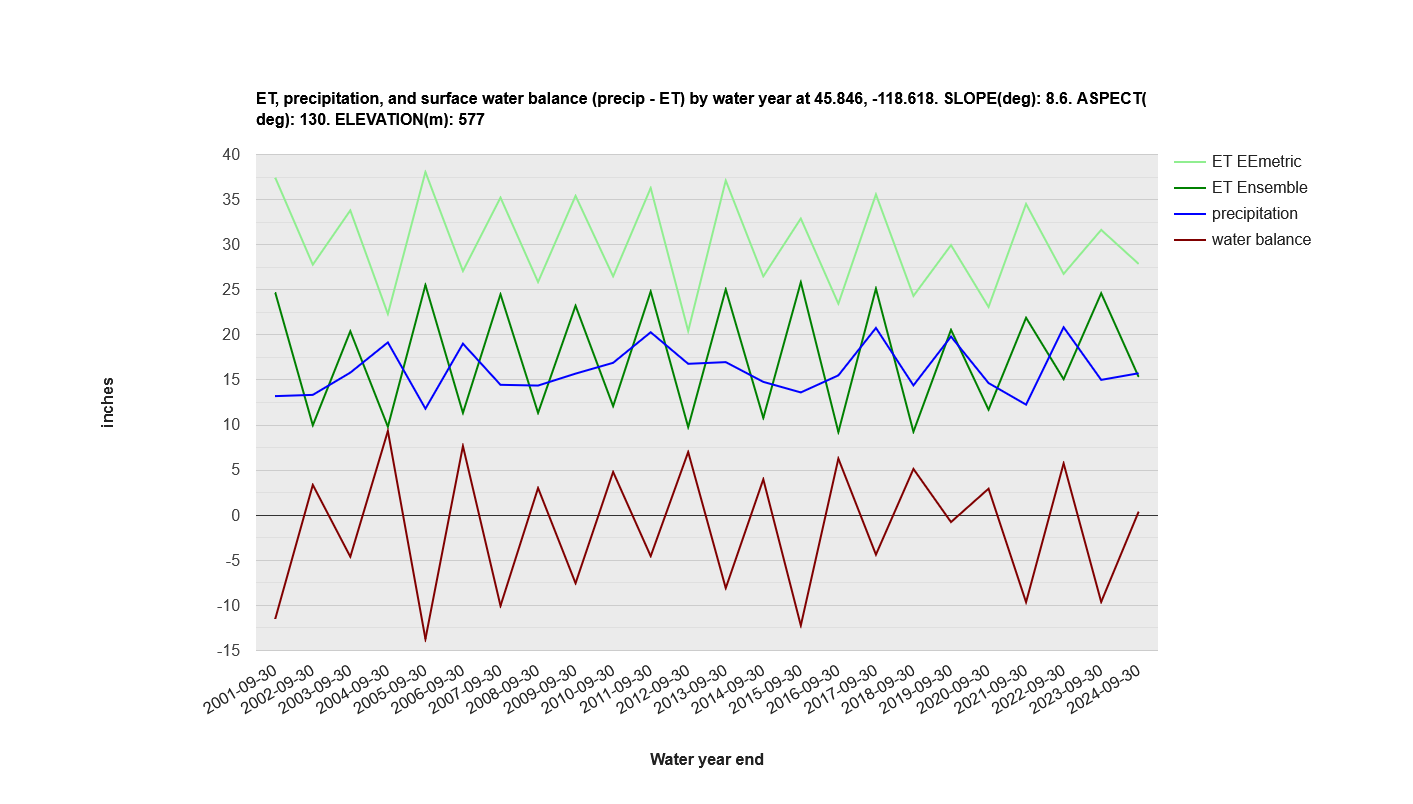
The app also allows you to chart 24 years of annual ET, precipitation, and the difference at a point, such as this one in an unirrigated field in eastern Oregon that shows the alternating pattern of wheat/fallow:
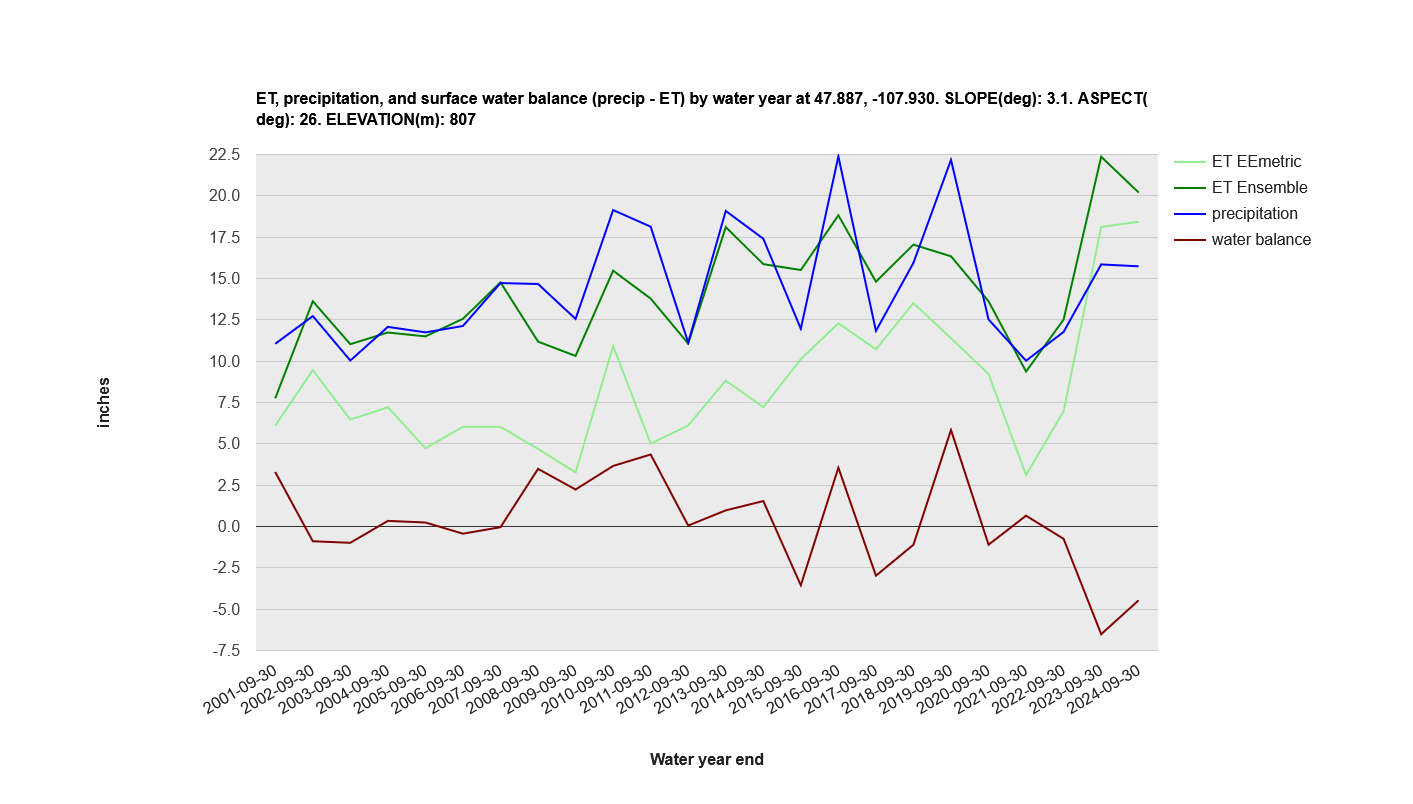
The chart below may show increased effectiveness of water cycling (less bare ground, less runoff?) on unirrigated Montana rangeland from 2021 to 2024. The rise in ET (on vegetated landscapes, most ET is from plant transpiration) may also reflect a better distribution of rainfall over time. Local knowledge is a critical ingredient here.
The app also provides several additional map layers for understanding water cycling:
-
an “anomaly” layer, showing the change or difference in water balance between water years 2022-24 and the mean of 2001-2024
-
an NDVI (normalized difference vegetation index, an indicator of photosynthesis) layer approximating the median NDVI since 2013 from Landsat 8
-
a hillshade layer indicating slope and aspect, as water runs downhill, and precipitation falling on ridges can contribute to ET further down.
The effectiveness of water cycling, especially in more arid or brittle areas, is a major factor in soil health and landscape function, a major factor in the ability of a landscape to capture and use sunlight energy in the form of water, which in turn is conditioned by the photosynthesis of plants and the porosity and aggregation of soil. The OpenET estimates provide a window over space and time for this.
Recent Posts
Archive
Categories
- Events (2)
- policy and framing (23)
- ruminations (3)
Tags
- atlas (2)
Authors
- Peter Donovan (137)
- Didi Pershouse (3)